Projects
Things I do, including research, academic course projects, and miscellaneous interests.
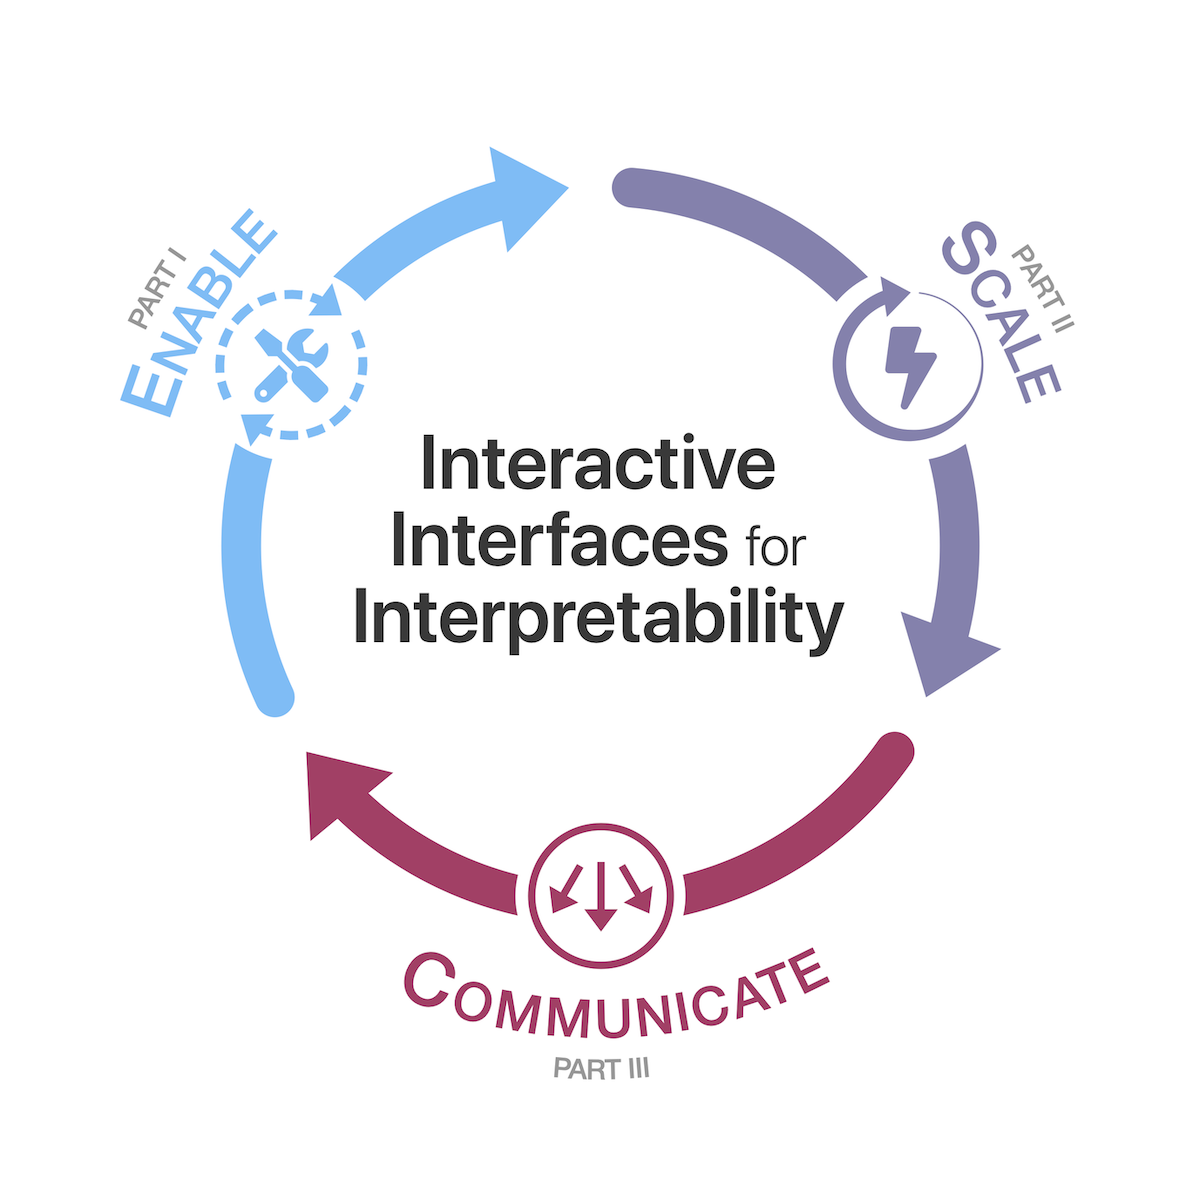
PhD Dissertation
My dissertation contributed interactive interfaces to enable machine learning interpretability at scale and for everyone.
Scaling deep learning interpretability by visualizing activation and attribution summarizations
TVCG
2020
A design probe to understand how data scientists understand machine learning models
CHI
2019
An interrogative survey
TVCG
2018
Research
Research publications for fans of human-computer interaction, data visualization, and machine learning.
Auto-interpreting LLM features with a structured language
ICLR, 2026
Low-friction, interactive embedding visualization
VIS, 2025
Tools for guiding the unbounded space of LLM behaviors
UIST, 2025
Apple Intelligence Foundation Language Models: Tech Report 2025
arXiv, 2025
A scalable approach to clustering embedding projections
arXiv, 2025
Human-in-the-loop data augmentation
CHI, 2025
Interactively evaluating efficiency and behavior across ML model compression experiments
TVCG, 2025
Apple Intelligence Foundation Language Models
arXiv, 2024
Scaffolding LLM-Generated Code with Ephemeral UIs in Computational Notebooks
VL/HCC, 2024
Lessons learned from practitioners creating on-device machine learning experiences
CHI, 2024
Interactively optimizing machine learning models for efficient inference
CHI, 2024
Scalable interactive visualization for exploring large machine
ACL, 2023
Collaborative machine learning model building with families
IDC, 2023
Helping machine translation practitioners prioritize model improvements
CHI, 2023
Proactive data collection and iteration for machine learning using reflexive planning, monitoring, and density estimation
AI&HCI, 2023
Composing interactive interfaces for machine learning
CHI, 2022
Generalizing confusion matrix visualization to hierarchical and multi-output labels
CHI, 2022
Scalable automatic visual summarization of concepts in deep neural networks
TVCG, 2022
Examining interactive article design by synthesizing theory from education, journalism, and visualization
Distill, 2020
Learning convolutional neural networks with interactive visualization
TVCG, 2021
Interactively deciphering adversarial attacks on deep neural networks
VIS, 2020
Fluid moves between code and graphical work in computational notebooks
UIST, 2020
Understanding and visualizing data iteration in machine learning
CHI, 2020
The future of notebook programming is fluid
CHI, 2020
Interactive visual learning for convolutional neural networks
CHI, 2020
Interactive interpretation of adversarial attacks on deep learning
CHI, 2020
Scaling deep learning interpretability by visualizing activation and attribution summarizations
TVCG, 2020
Visual analytics for discovering intersectional bias in machine learning
VAST, 2019
Combining visualization and verbalization for interpretable machine learning
VIS, 2019
Scaling deep learning interpretability by visualizing activation and attribution summarizations
VIS, 2019
Launching an interactive digital magazine
VisComm, 2019
A design probe to understand how data scientists understand machine learning models
CHI, 2019
Managing messes in computational notebooks
CHI, 2019
Discovery of intersectional bias in machine learning using automatic subgroup generation
Debug ML, 2019
Exploring and understanding neural networks by comparing activation distributions
PacificVis, 2019
Local graph exploration in a global context
IUI, 2019
Scalable k-core decomposition for static graphs using a dynamic graph data structure
Big Data, 2018
An interrogative survey
TVCG, 2018
The beginner's guide to dimensionality reduction
VISxAI, 2018
Fast, practical defense and vaccination for deep learning using JPEG compression
KDD, 2018
Compression to the rescue: defending from adversarial attacks across modalities
KDD, 2018
Interactive classification for deep learning interpretation
CVPR, 2018
Interactive visual exploration of graph query results
TVCG, 2018
3D exploration of graph layers via vertex cloning
VAST, 2017
Exploring entertainment video using color and dialogue
VIS4DH, 2017
A deep learning approach for population estimation from satellite imagery
GeoHum, 2017
mHealth visual discovery dashboard
Ubicomp, 2017
Visual graph query construction and refinement
SIGMOD/PODS, 2017
Towards understanding deep learning representations via interactive experimentation
CHI, 2017
Protecting and vaccinating deep learning with JPEG compression
arXiv, 2017
The effect of numerical parameters on eddies in oceanic overflows: a laboratory and numerical study
CMEM, 2019
Experimental and numerical comparison of oceanic overflow
APS DFD, 2014
Interactive Articles
Enhanced reading experiences that demonstrate what’s possible when dynamic media are effectively combined.
Visualizing the Apple Women's Health Study
2023
Examining interactive article design by synthesizing theory from education, journalism, and visualization
Distill
2020
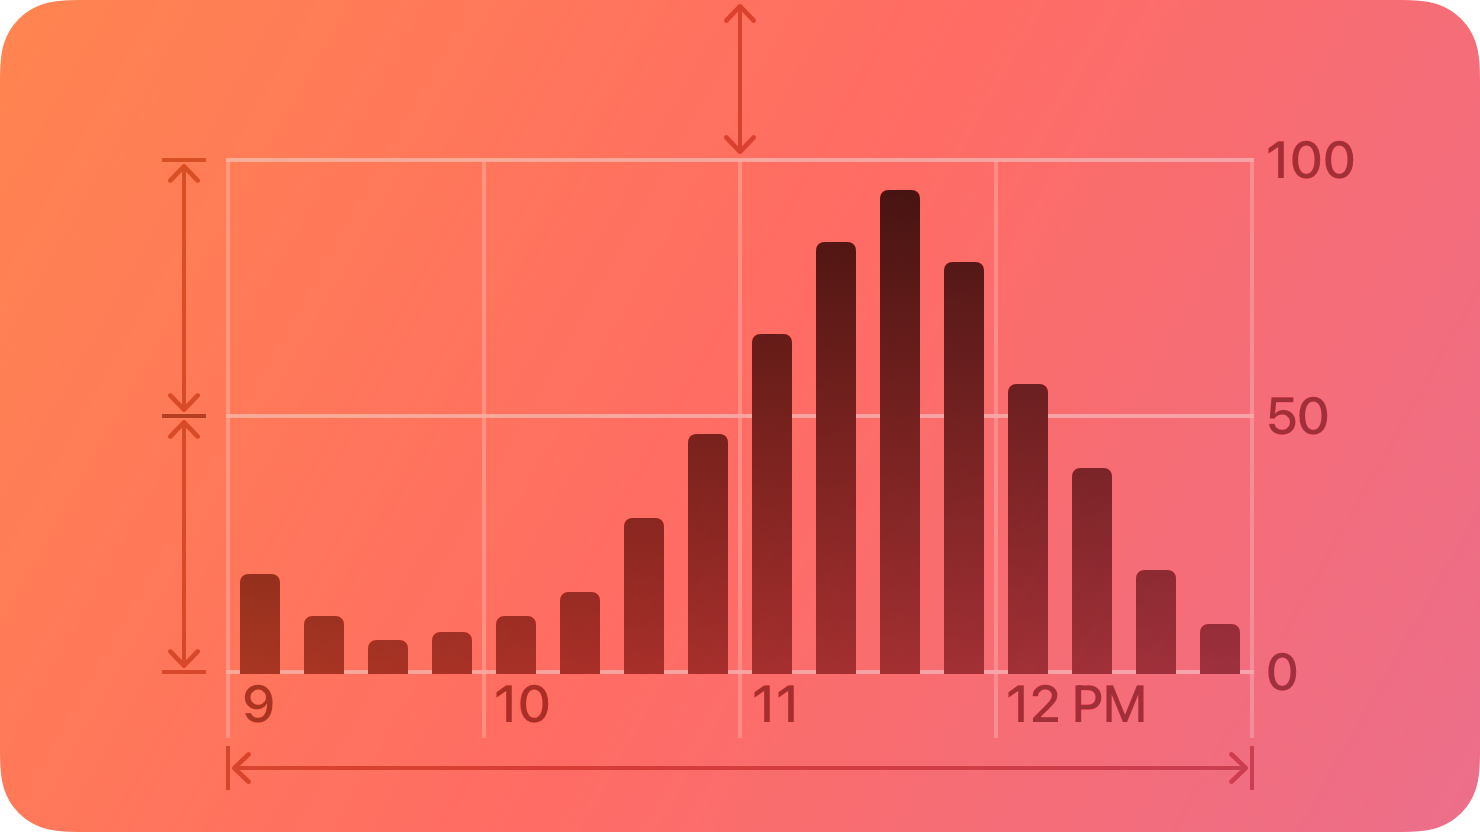
Apple Chart Design Guidelines
Guidance and best practices to help designers and developers create the best charts for any Apple platform.
Generative AI empowers you to enhance your app or game with dynamic content and offer intelligent features that unlock new levels of creativity, connection, and productivity
2025
Presenting data in a chart can help you communicate information with clarity and appeal
2022
Organize data in a chart to communicate information with clarity and visual appeal
2022
Parametric Press Articles
A born-digital, experimental magazine dedicated to showcasing the expository power of the web.
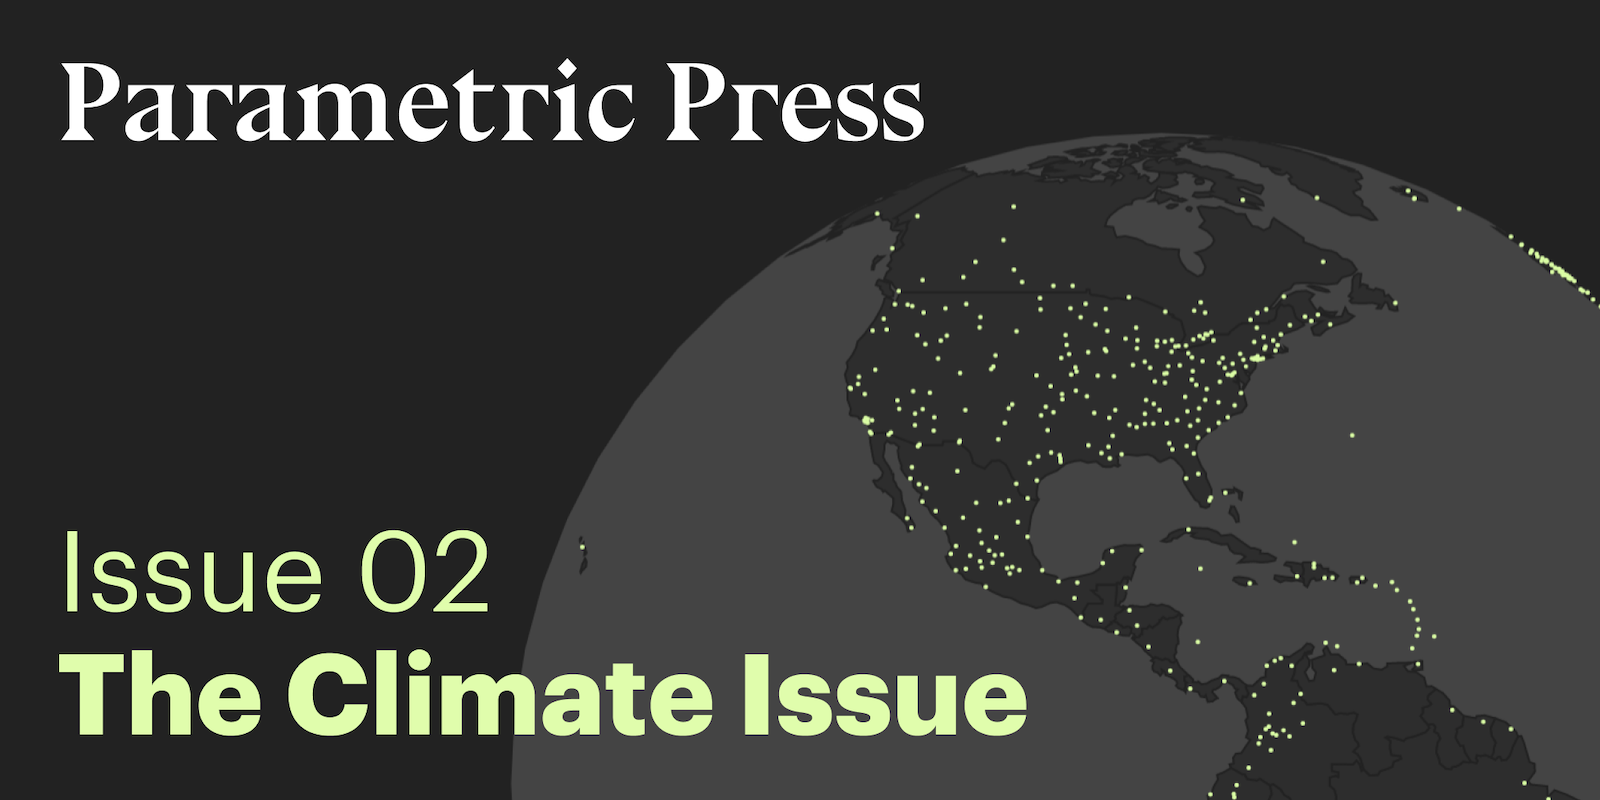
Interactively analyze and learn about our climate’s past, present, and future
2020
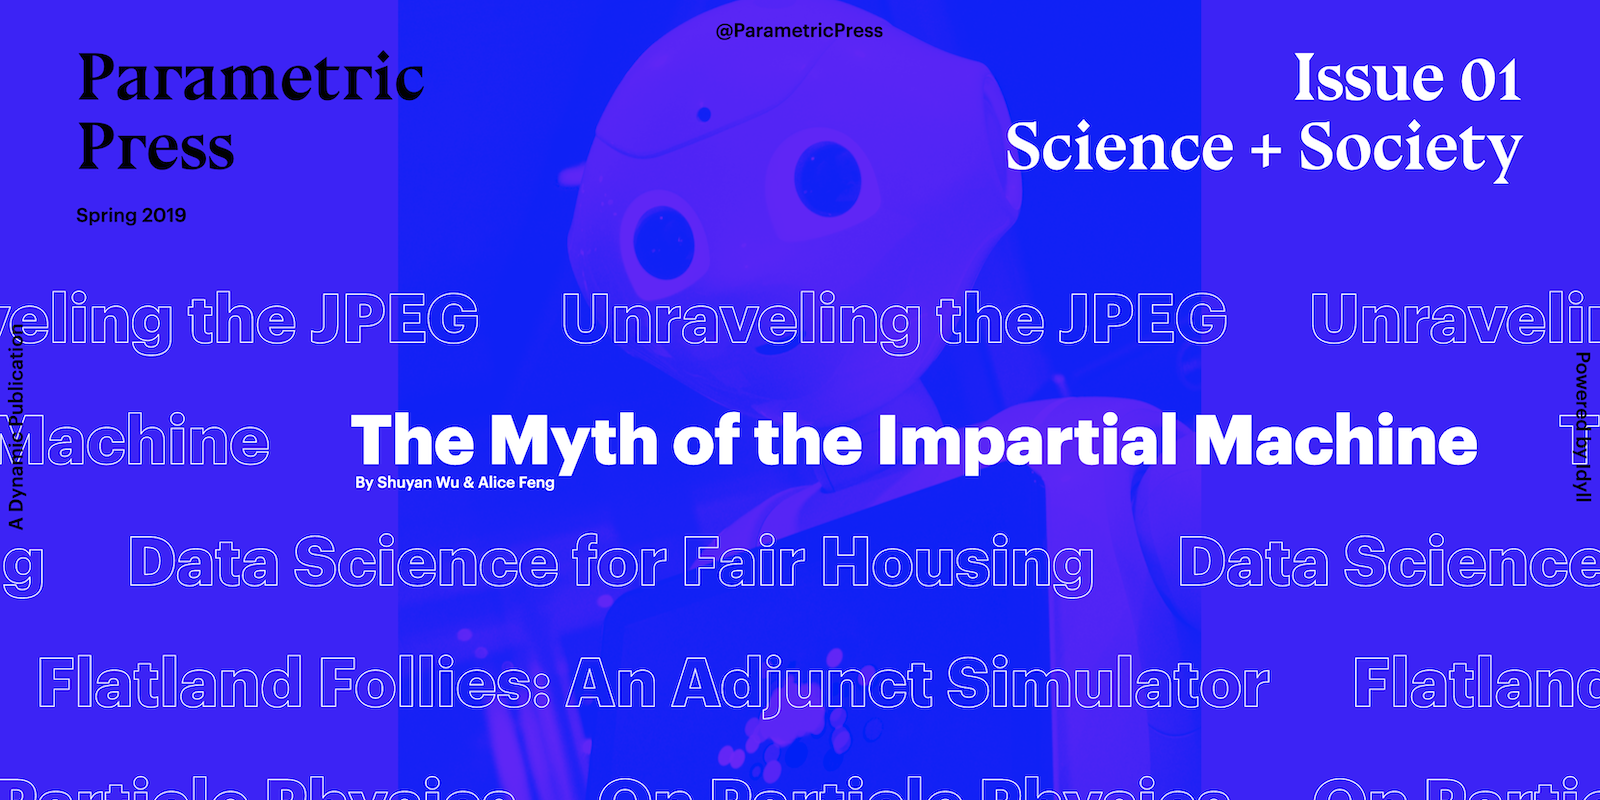
Examine scientific and technological phenomena that stand to shape society at large
2019
Undergraduate Thesis
3D Printing the Trefoil Knot and its Pages 2015
REU
Math & Computational Science REU 2014
Course Projects
Other