A Viz of Ice and Fire
An interactive, narrative visualization summarizing the visual and textual aspects of the hit HBO series Game of Thrones.
The hit TV show Game of Thrones has won critical acclaim and the attention of millions of fans with its inspiring cinematography and brilliant dialogue. Dedicated fans of the show can recall critical scenes and key quotes with ease, but can they pick out high-level trends that emerge over the course of the series?
For instance, in which season was the frozen North the focus of the plot? With all the violent twists in the plot, how often does the show’s dialogue tend toward the topic of death? This project for CS 7450 Information Visualization seeks to highlight these large-scale patterns that might otherwise be missed.
You can view the web visualization here.
The visualization highlights the high-level aspects of each Game of Thrones episode, separating the data into visual and textual components. We process over 60 hours of video data and its subtitles (dialogue only) into nominal and quantitative variables of color and text frequencies as follows.
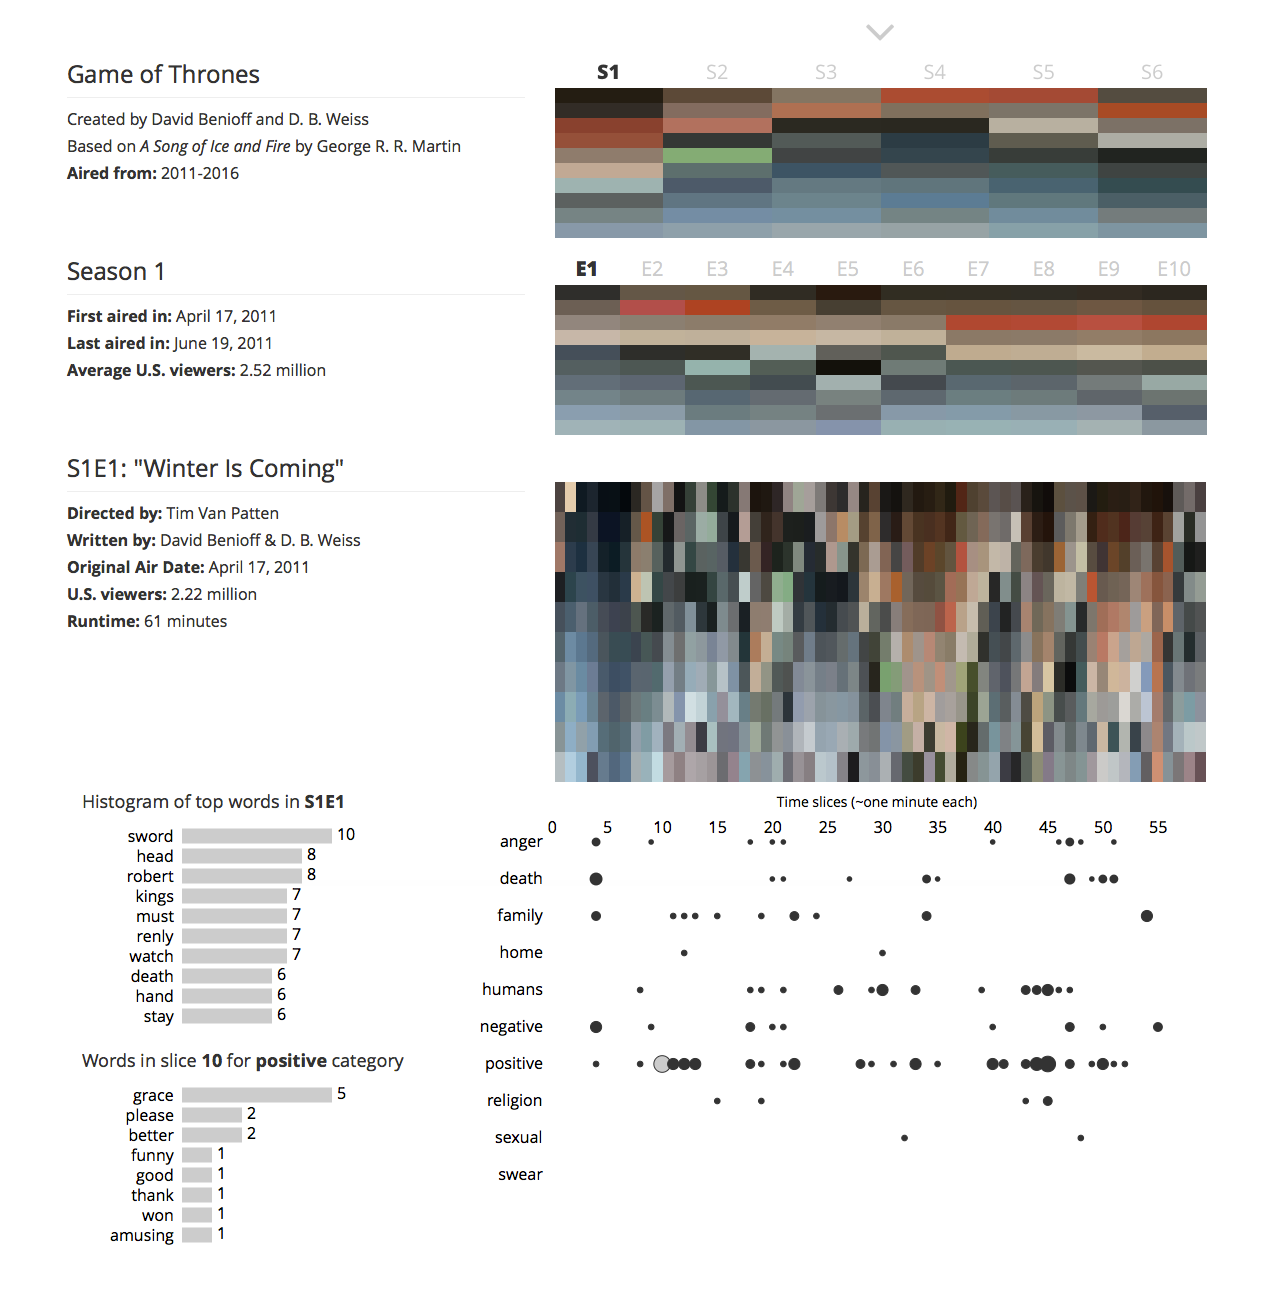
The figure above shows the main interactive component of the visualization. It currently shows the top 10 colors for the entire series on top, the top ten colors for season 1 in the middle, and the top ten colors for episode 1 towards the bottom, as well as summary of the spoken dialogue and what words contribute to each textual category. However, a user can select any season or episode to update all color blocks as well as the text bubble plot.
The rest of the narrative visualization presents three case studies using the visualization pick out key scenes from the show’s history, as well as present some high-level series analysis.
Our code is easily scalable to include and remove different textual categories, as well as do extra text analysis on the data we have generated. The full code, including the web visualization, the python scripts used to process and generate the data, and the data itself, can be found on Github.