mHealth Visual Discovery Dashboard


Abstract
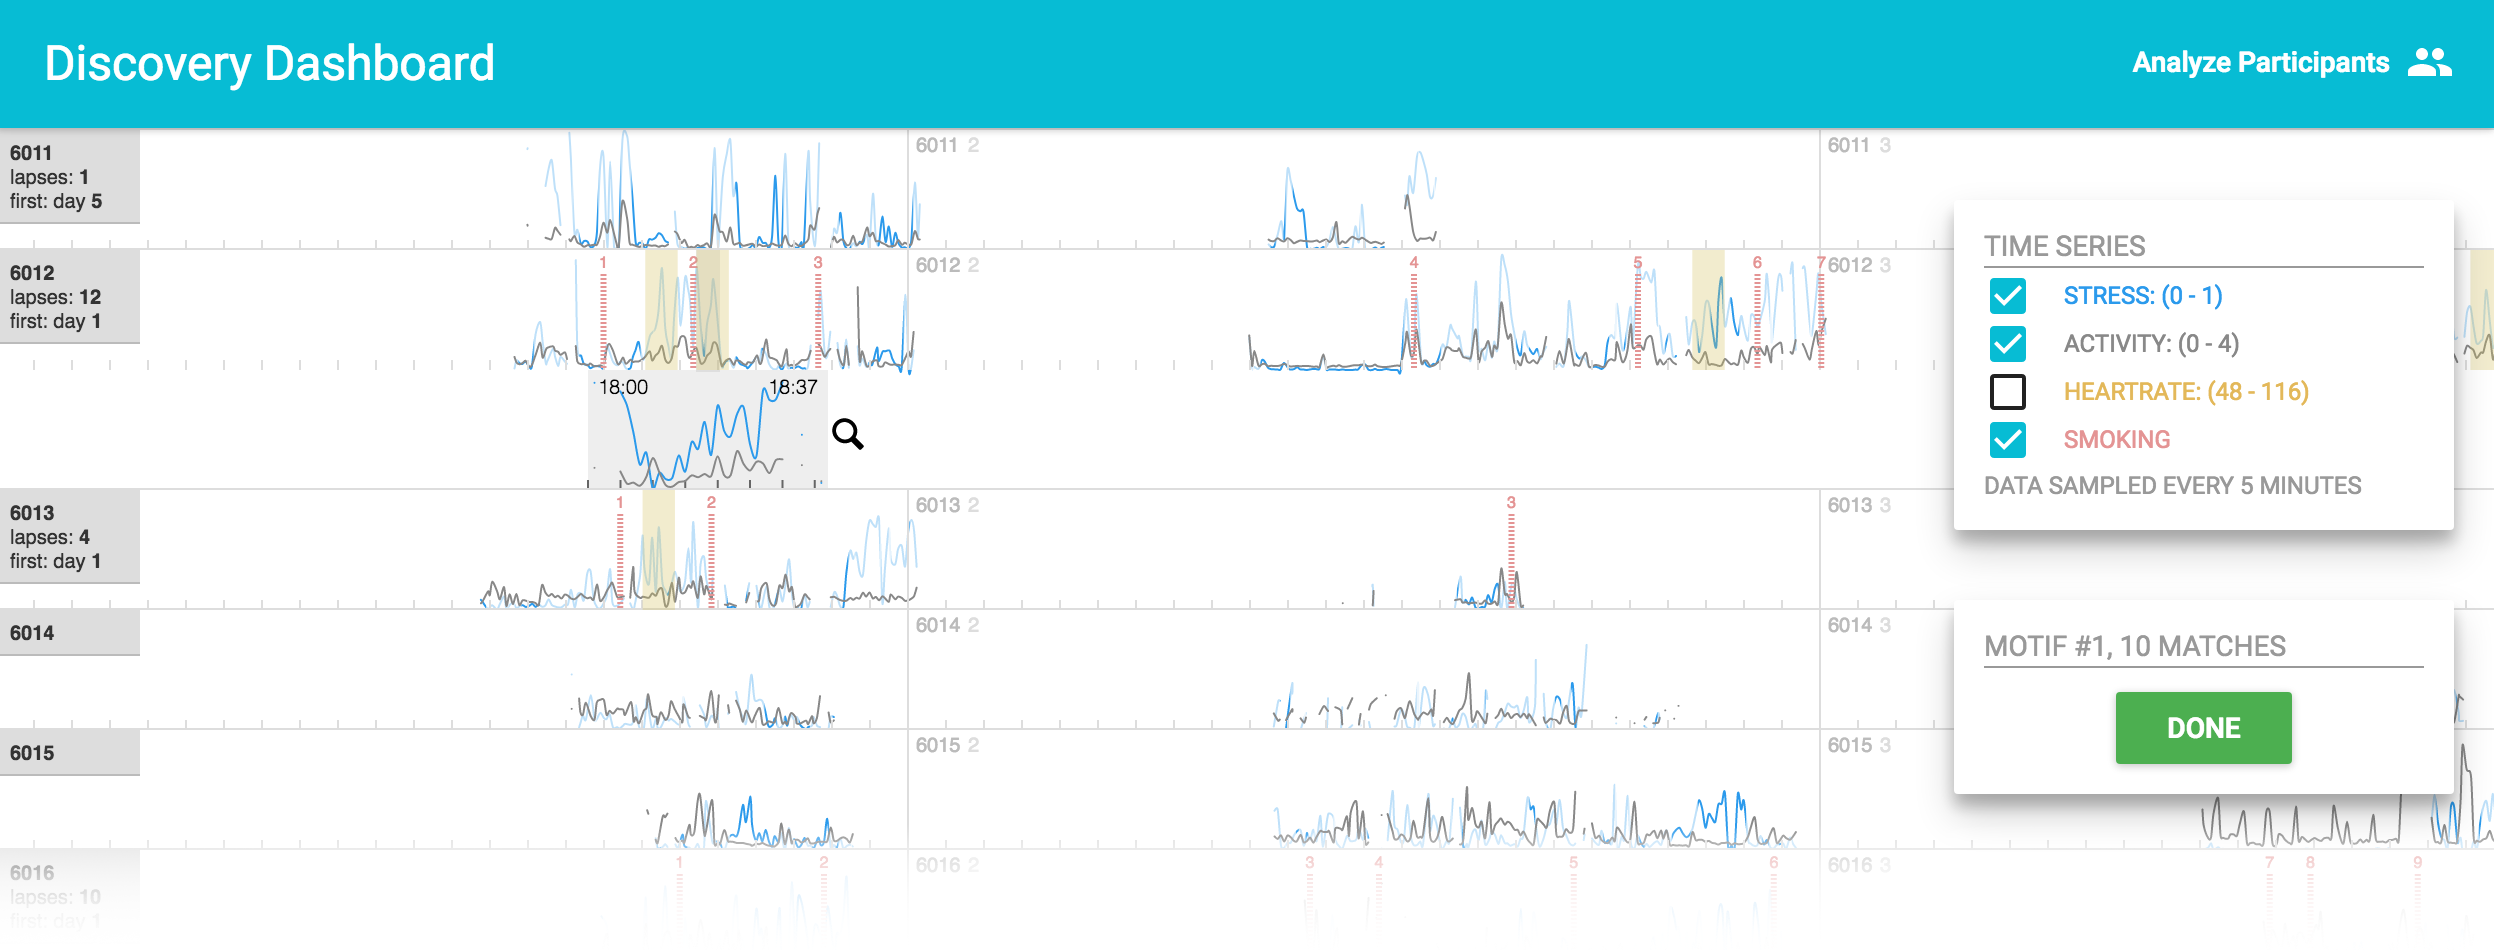
We present Discovery Dashboard, a visual analytics system for exploring large volumes of time series data from mobile medical field studies. Discovery Dashboard offers interactive exploration tools and a data mining motif discovery algorithm to help researchers formulate hypotheses, discover trends and patterns, and ultimately gain a deeper understanding of their data. Discovery Dashboard emphasizes user freedom and flexibility during the data exploration process and enables researchers to do things previously challenging or impossible to do — in the web-browser and in real time. We demonstrate our system visualizing data from a mobile sensor study conducted at the University of Minnesota that included 52 participants who were trying to quit smoking.
BibTeX
@inproceedings{fang2017mhealth,
    title={mHealth Visual Discovery Dashboard},
    author={Fang, Dezhi and Hohman, Fred and Polack, Peter and Sarker, Hillol and Kahng, Minsuk and Sharmin, Moushumi and al'Absi, Mustafa and Chau, Duen Horng},
    booktitle={Demo, Proceedings of the 2017 ACM International Joint Conference on Pervasive and Ubiquitous Computing and Proceedings of the 2017 ACM International Symposium on Wearable Computers},
    year={2017},
    publisher={ACM},
    doi={10.1145/3123024.3123170}
}