Personal Informatics: Health Easel
For CS 6750 Human-Computer Interaction, my team and I spent a semester working on a personal health informatics project, in particular exploring the role of personal tracking data in the doctor’s office.
Our project built upon previous research conducted at Georgia Tech where researchers worked with medical professionals to determine if and what types of personal tracking health data could be useful for diagnosis and treatment1.
Georgia Tech is involved in a project titled Campus Life that seeks to study if students’ mental health is correlated with academic performance through the the lens of digital footprints, i.e. quantified self-like data. The program gave mobile devices to students to record several types of information regarding passive and active student health.
Our class project aims to study how people, particularly Georgia Tech students, could bring quantified self data into on-campus doctor appointments to have a more data-informed health discussion during a consultation. Moreover, what technology would be required to facilitate this discussion?
Our final design, titled the Health Easel, is a new in-consultation health visualization prototype system that allows a patient to bring personal tracking data to their appointment and visualize relevant variables represented by simple charts on the display where both the patient and doctor can review in real-time to make informed health decisions.
User Research
Current Scenario
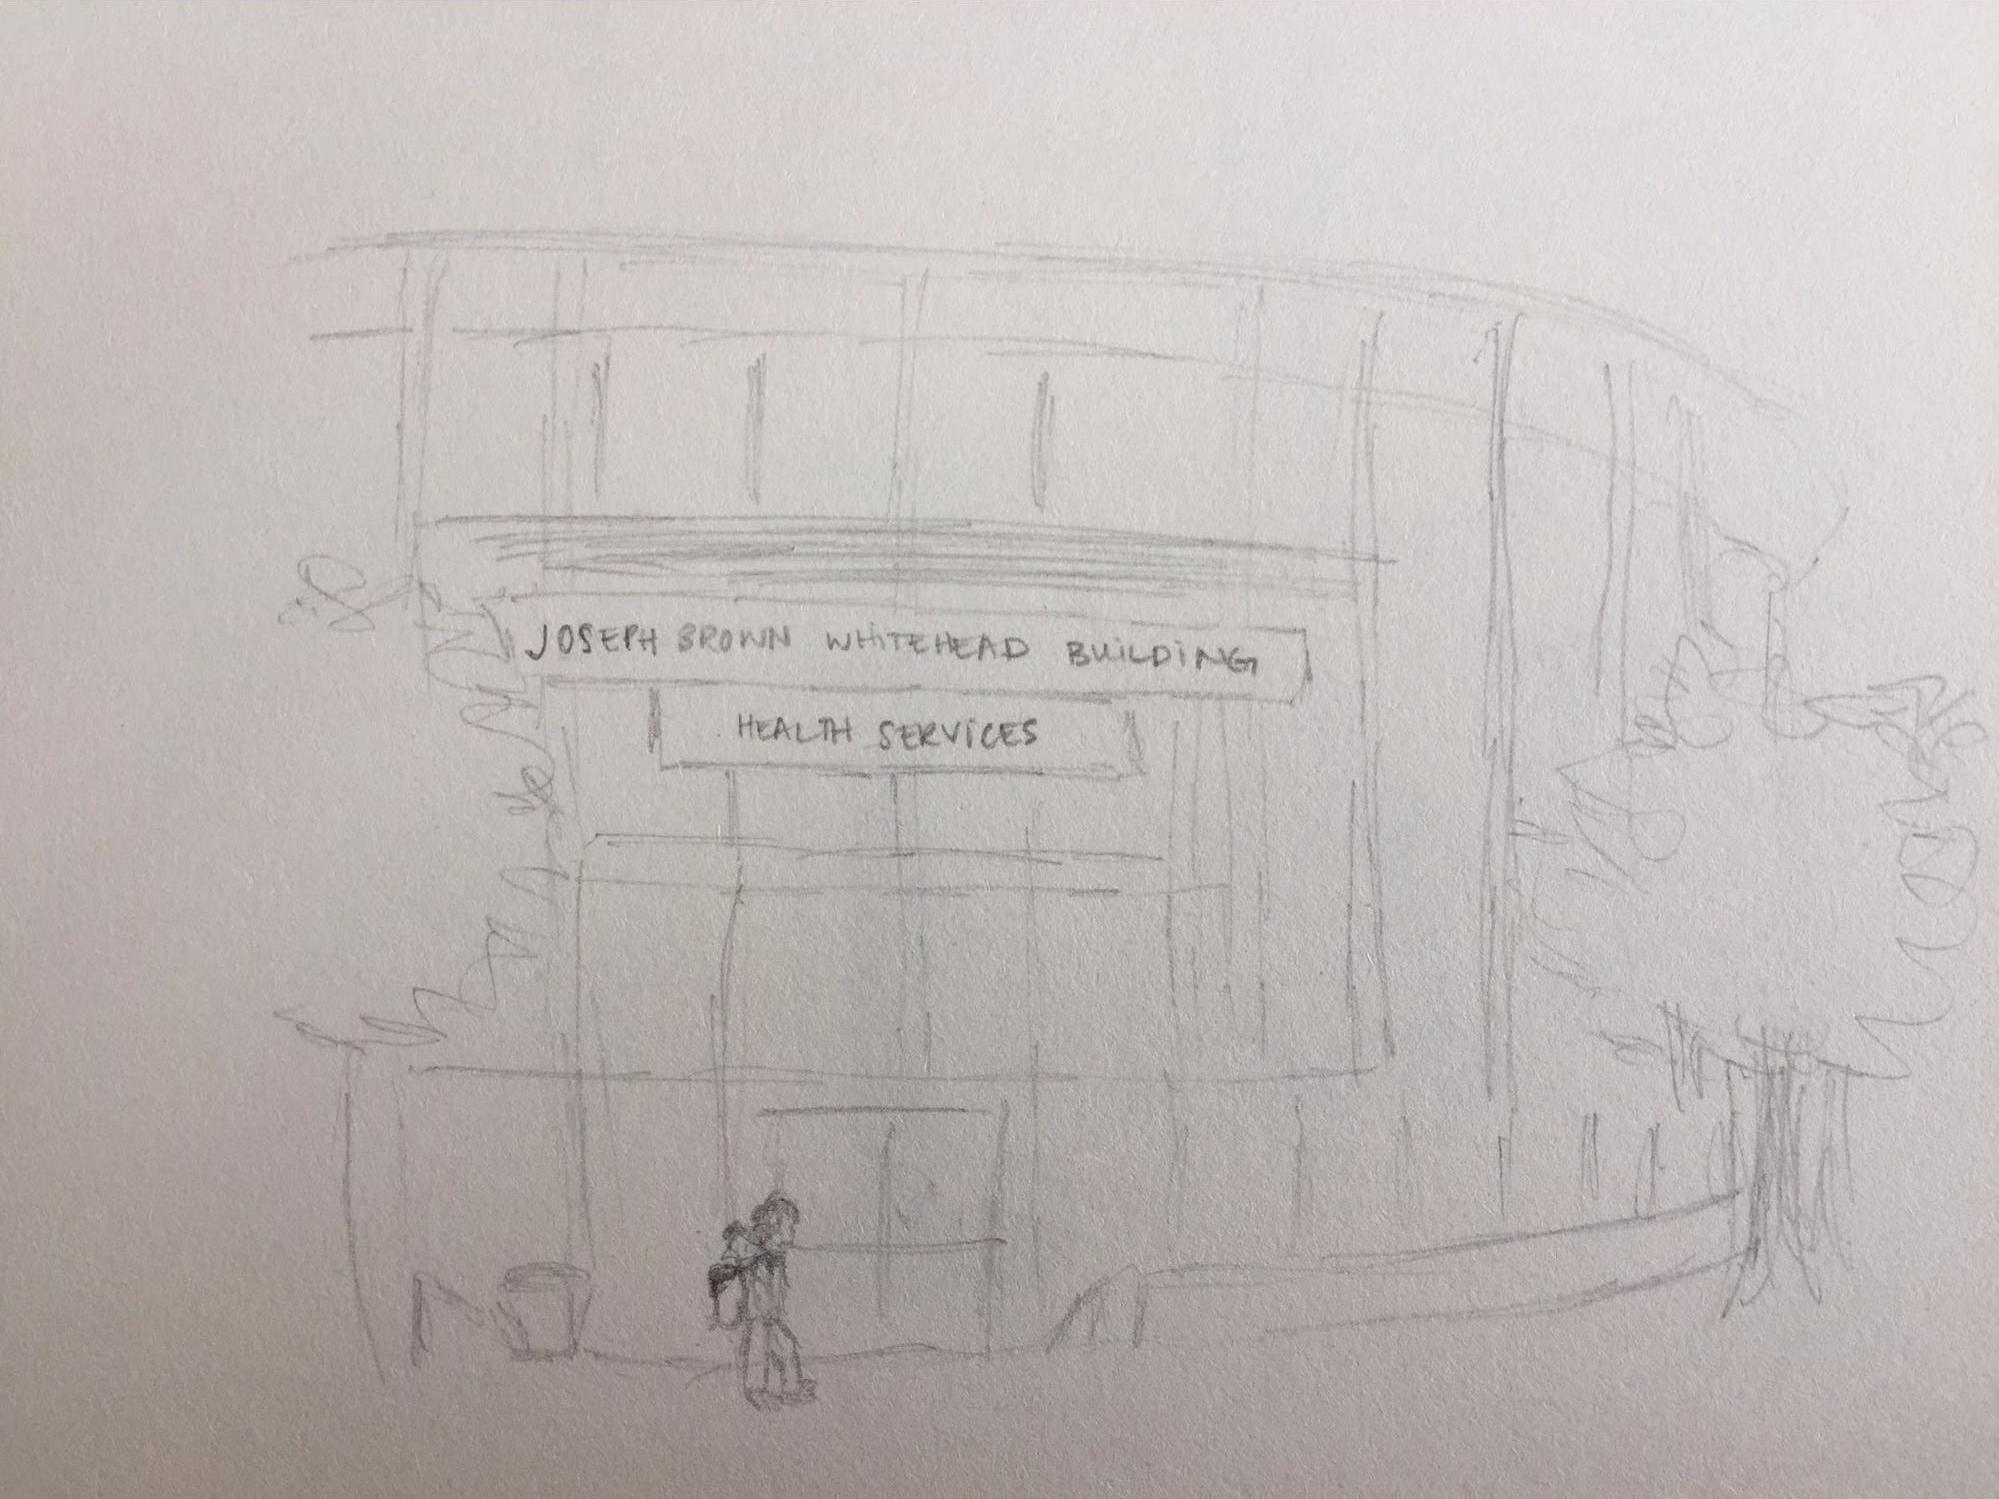
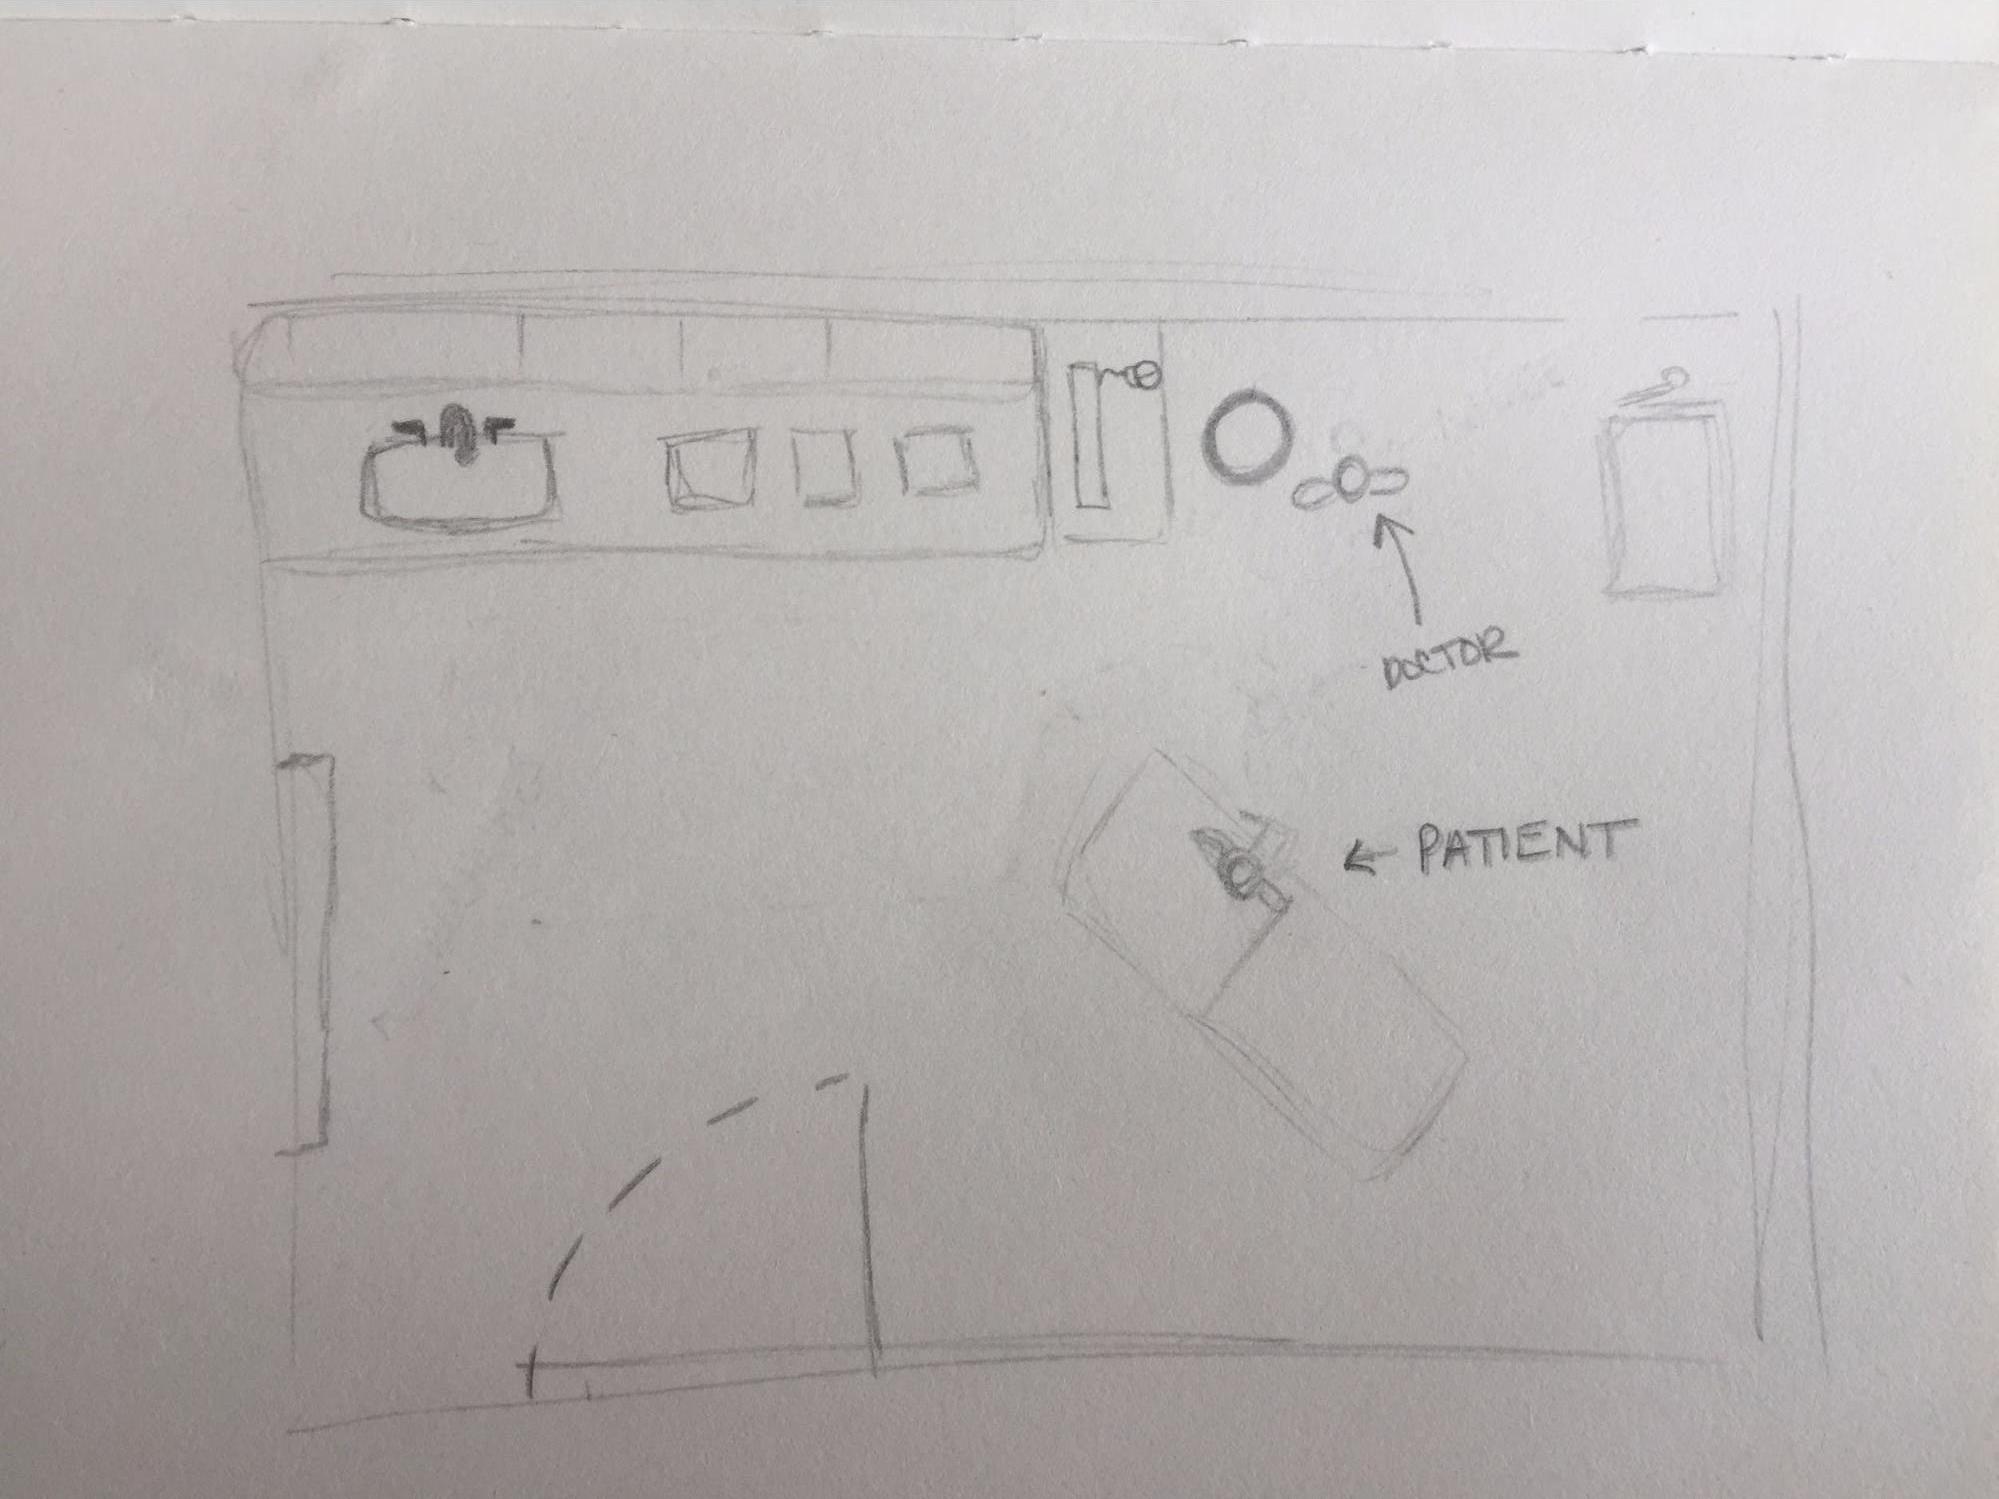
L: Student arrives at STAMPS.
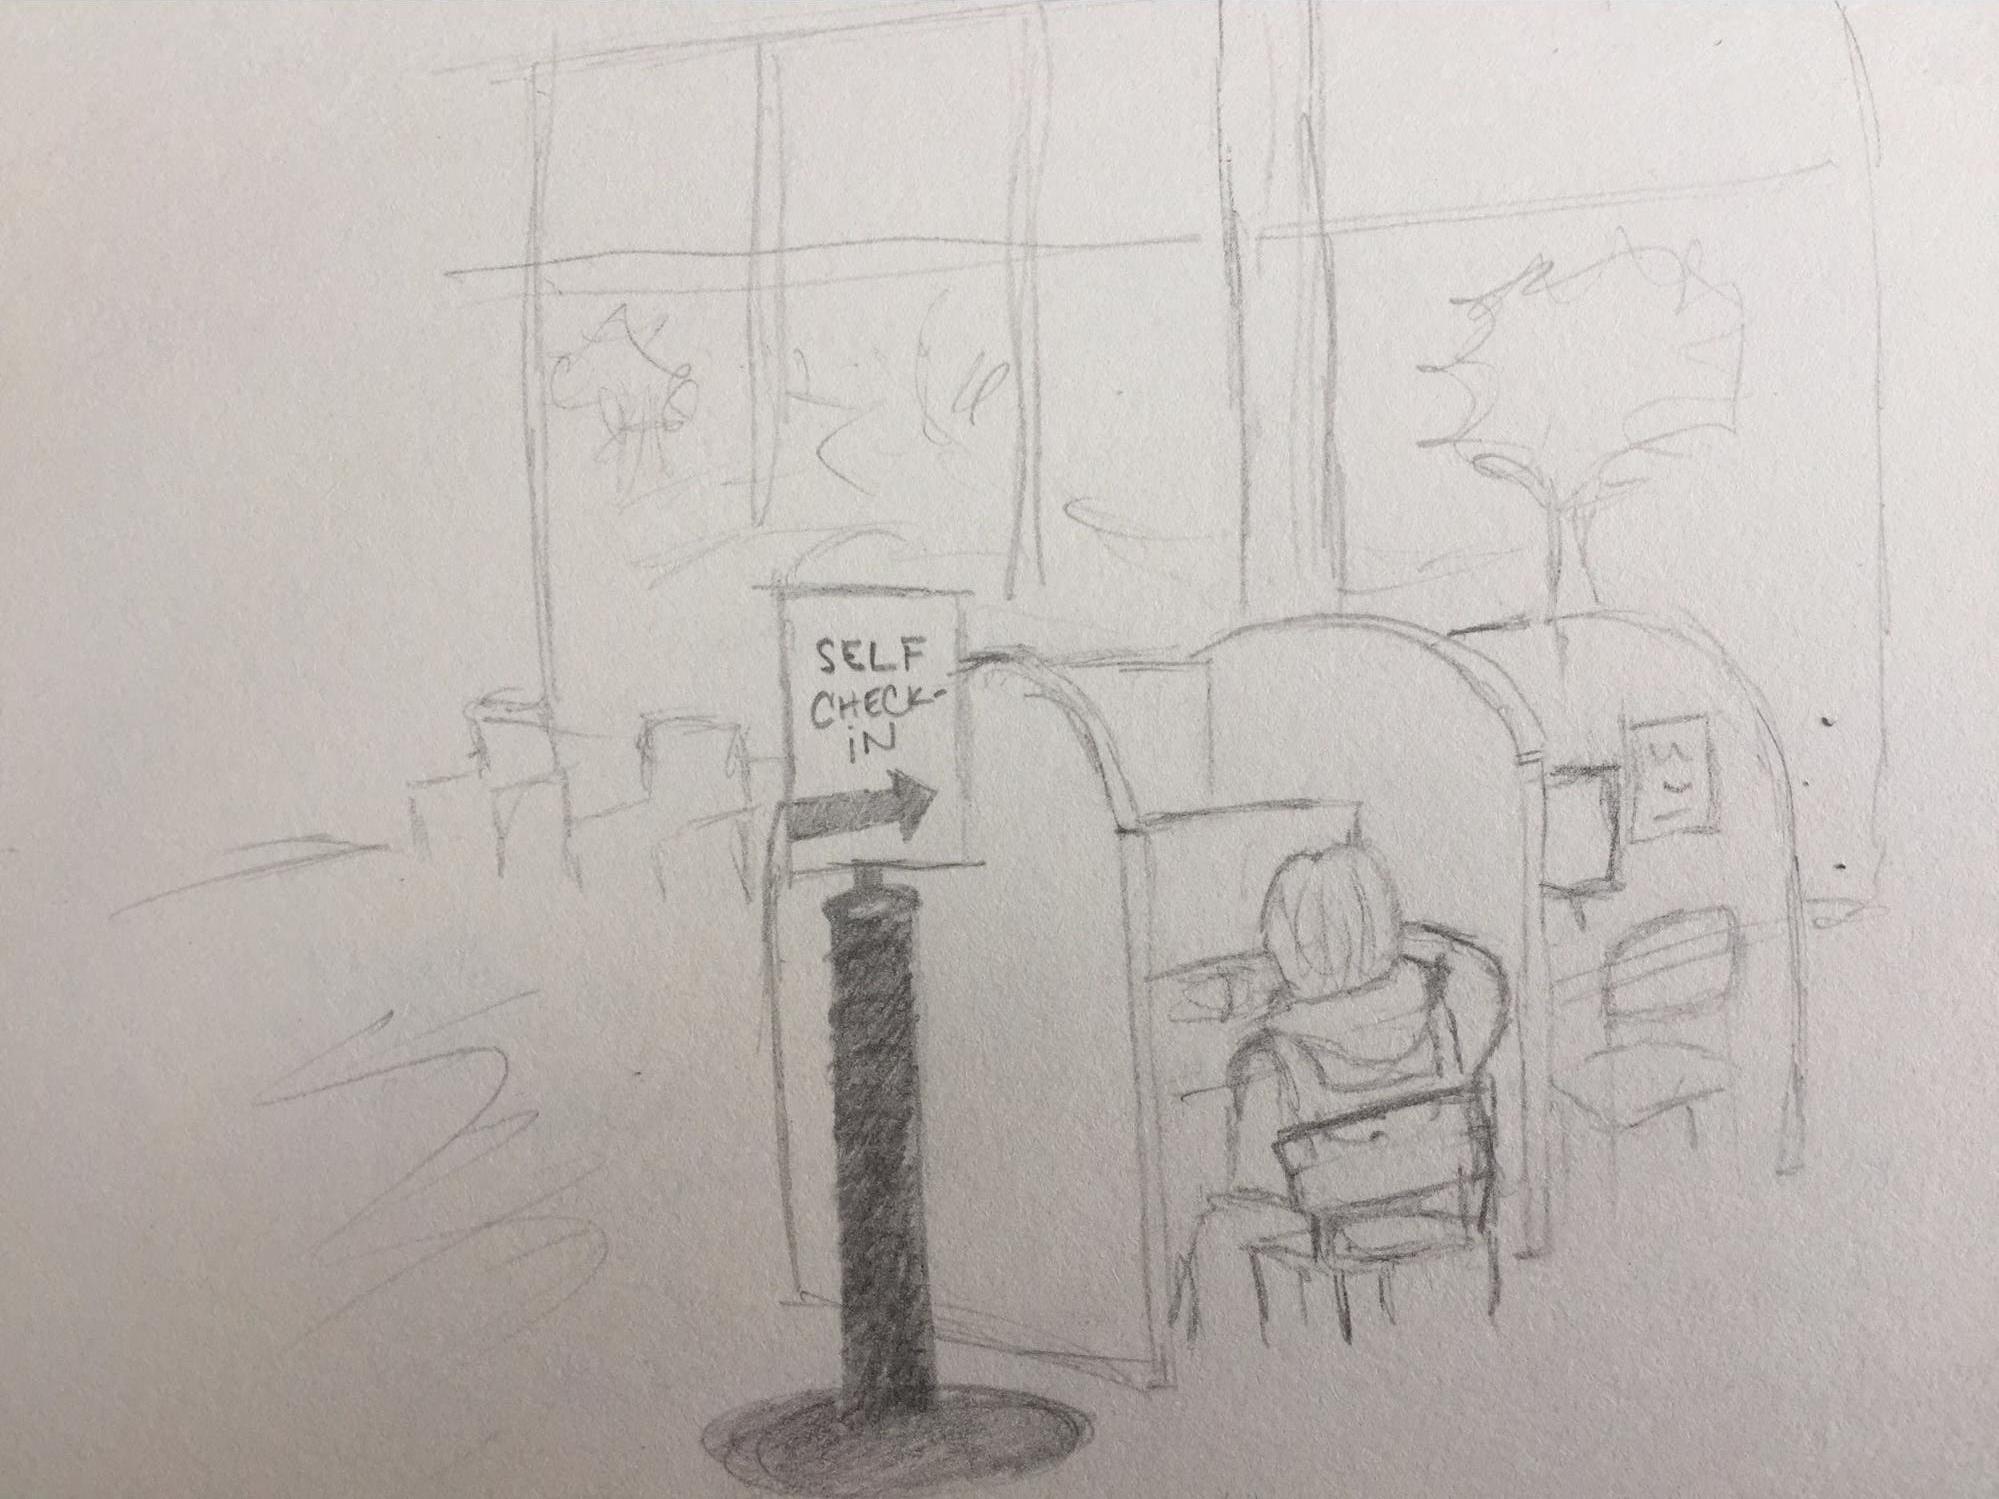
R: Student swipes BuzzCard or types in Student ID at 1 of 4 lobby desktop computers each with a privacy desk. Student answers questions pertaining to primary care appointment.
L: Student walks back to primary care office and checks in with receptionist.
R: Student waits in primary care center lobby. Typically students spend waiting time browsing their mobile phones.
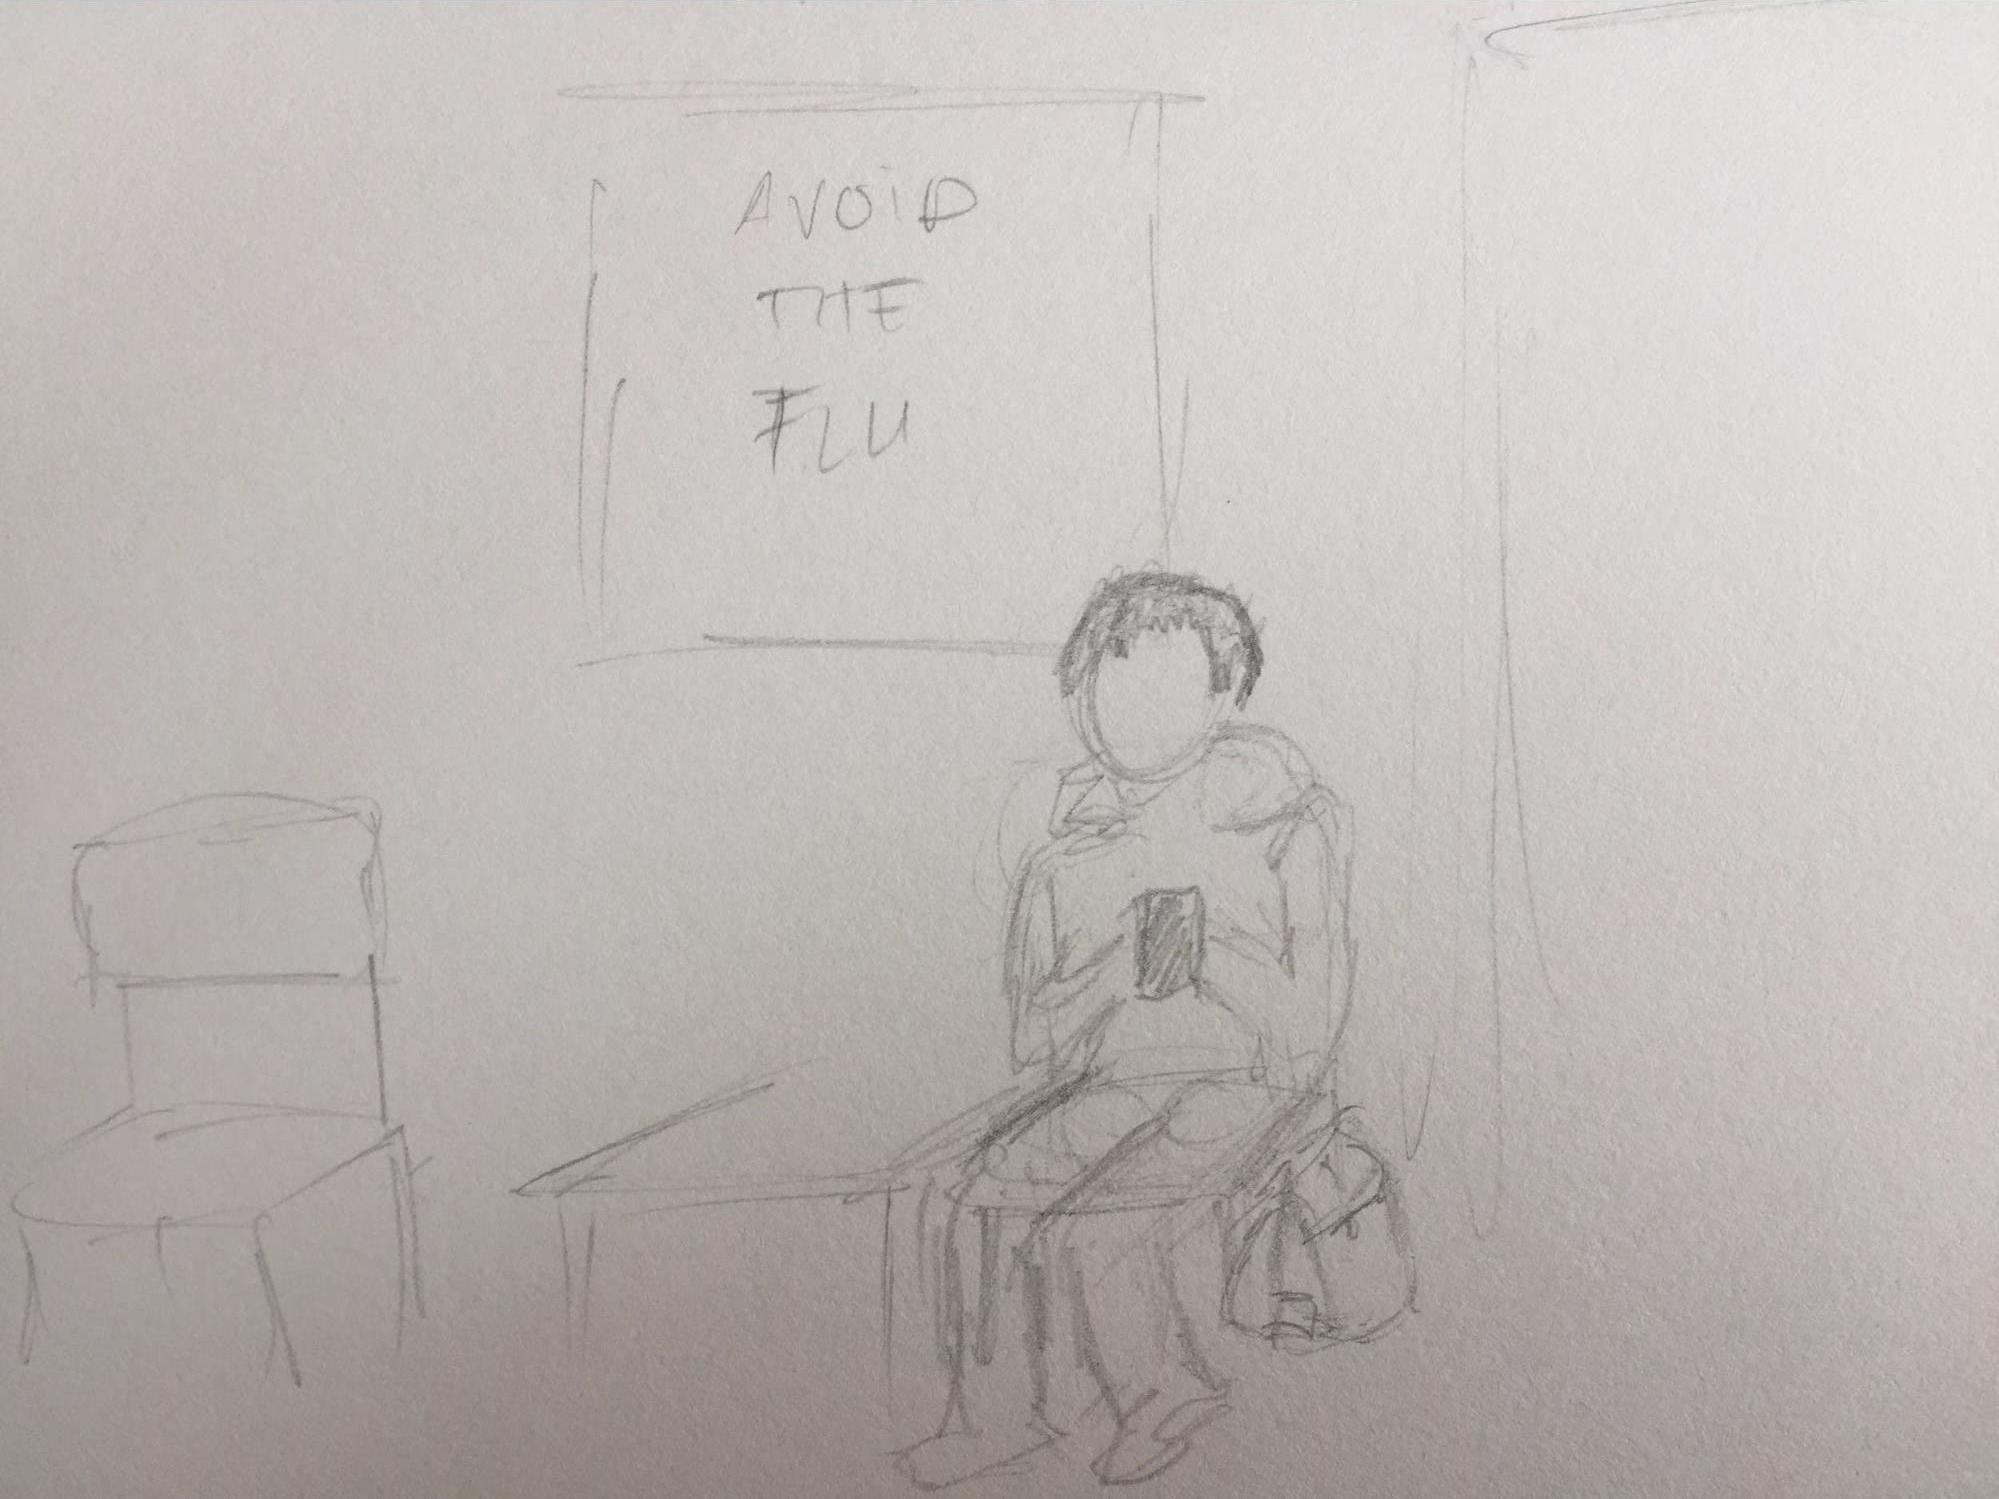
L: Student is shown into a private room by nurse and asked to take a seat on the medical examination chair stationed near the center of the room.
R: Nurse takes vitals and asks patients questions relevant to their health. Nurse turns away from patient to input this information into EHR system located on desktop. Student cannot see desktop unless 21” monitor is physically turned.
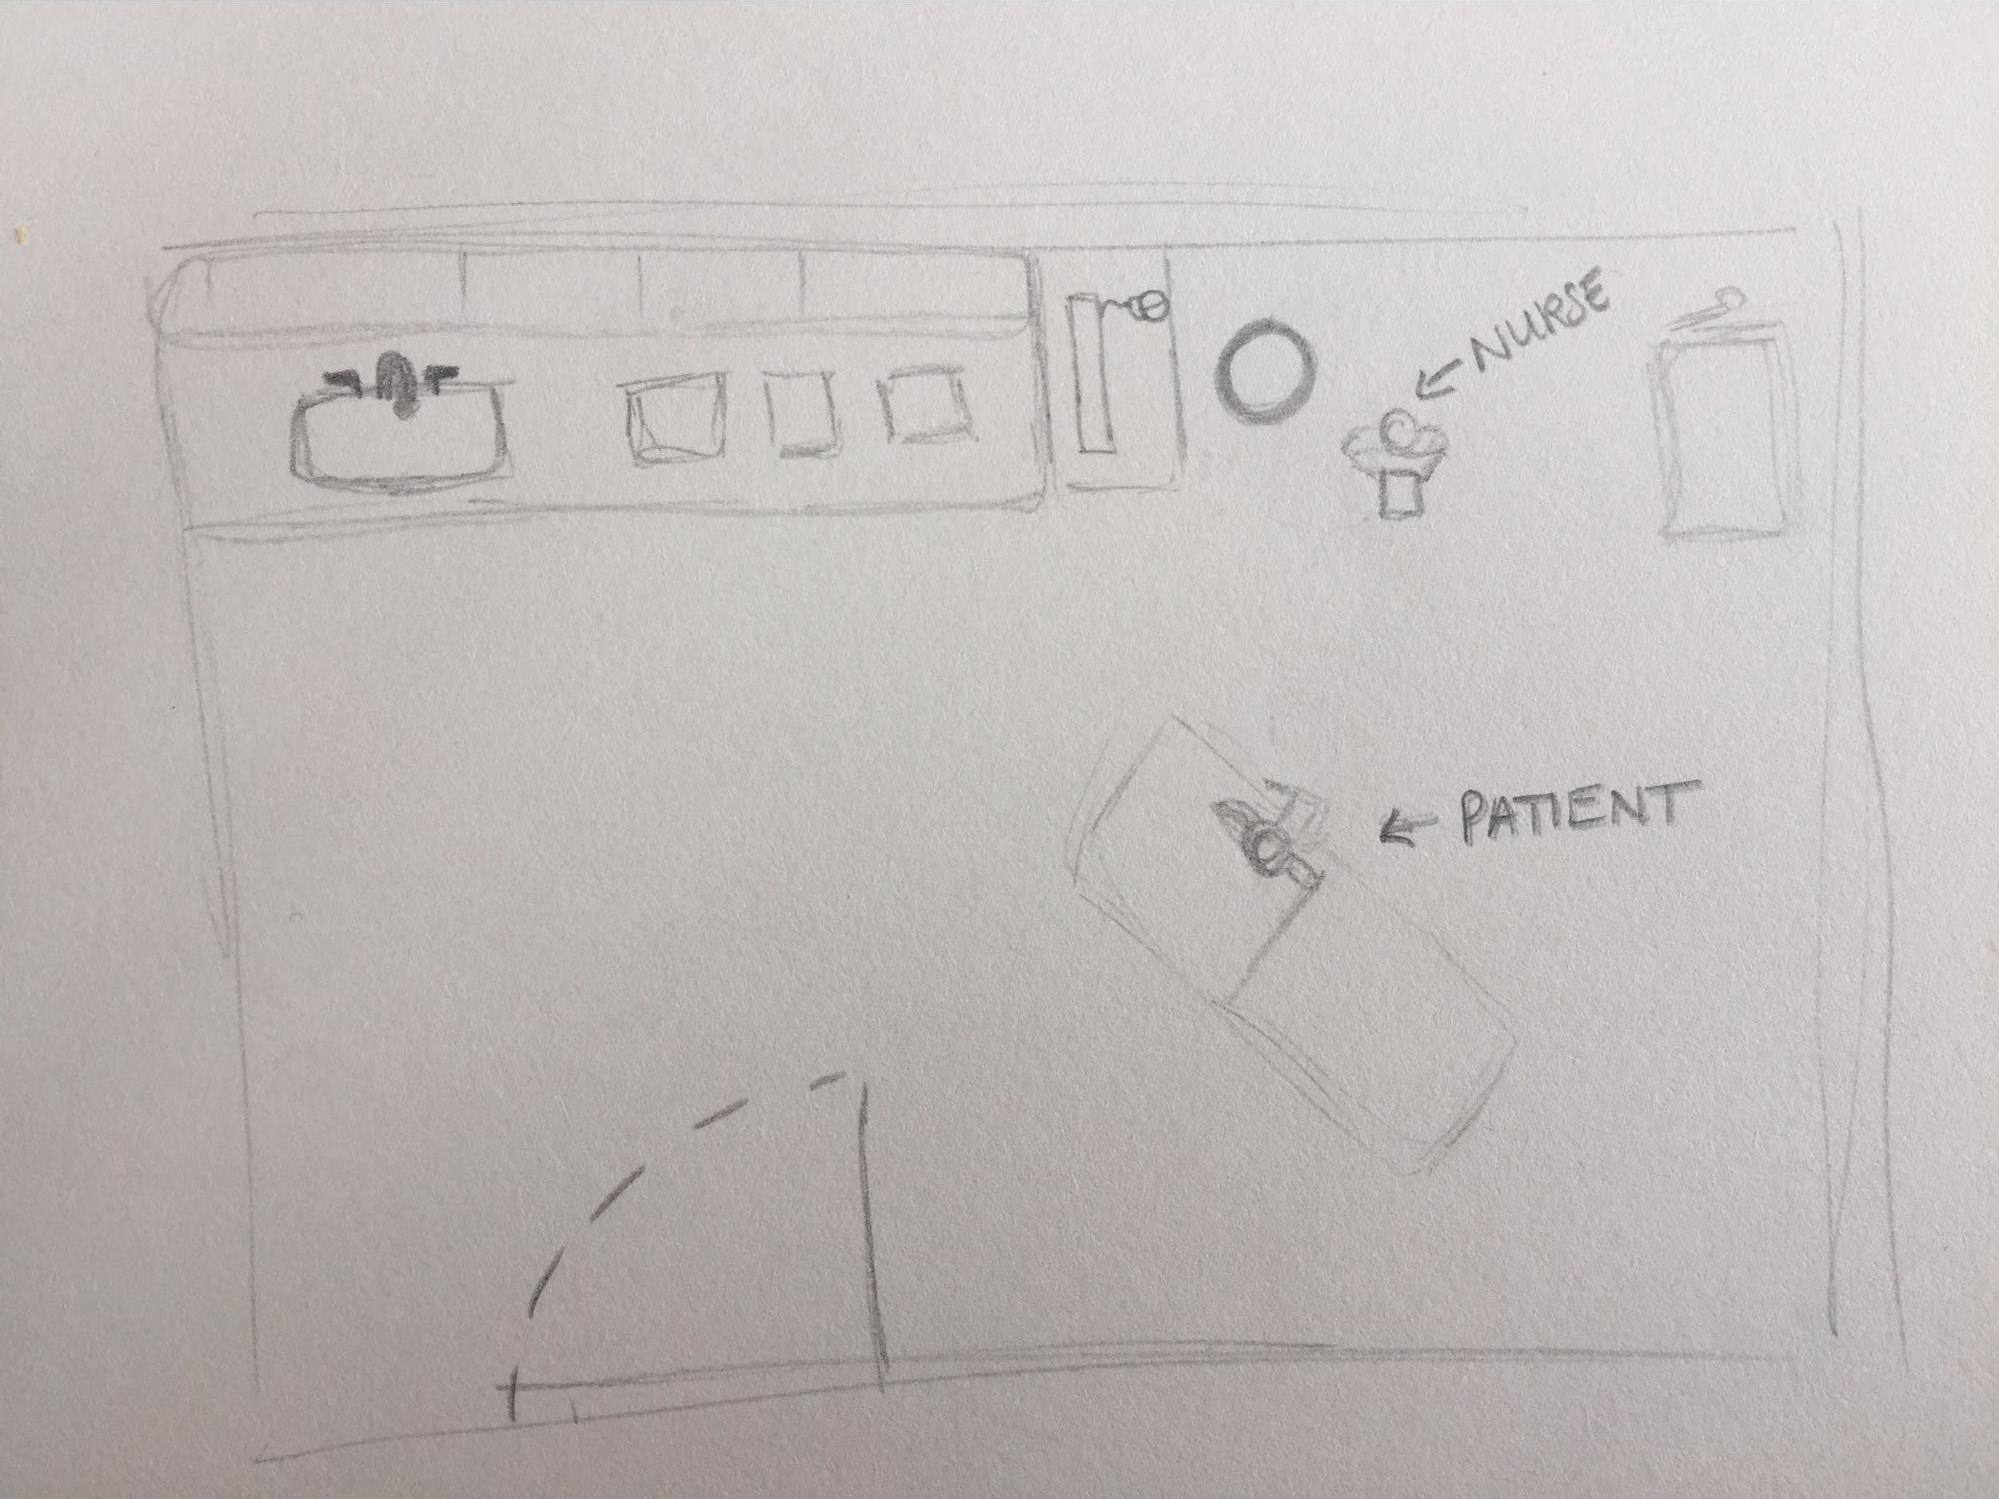
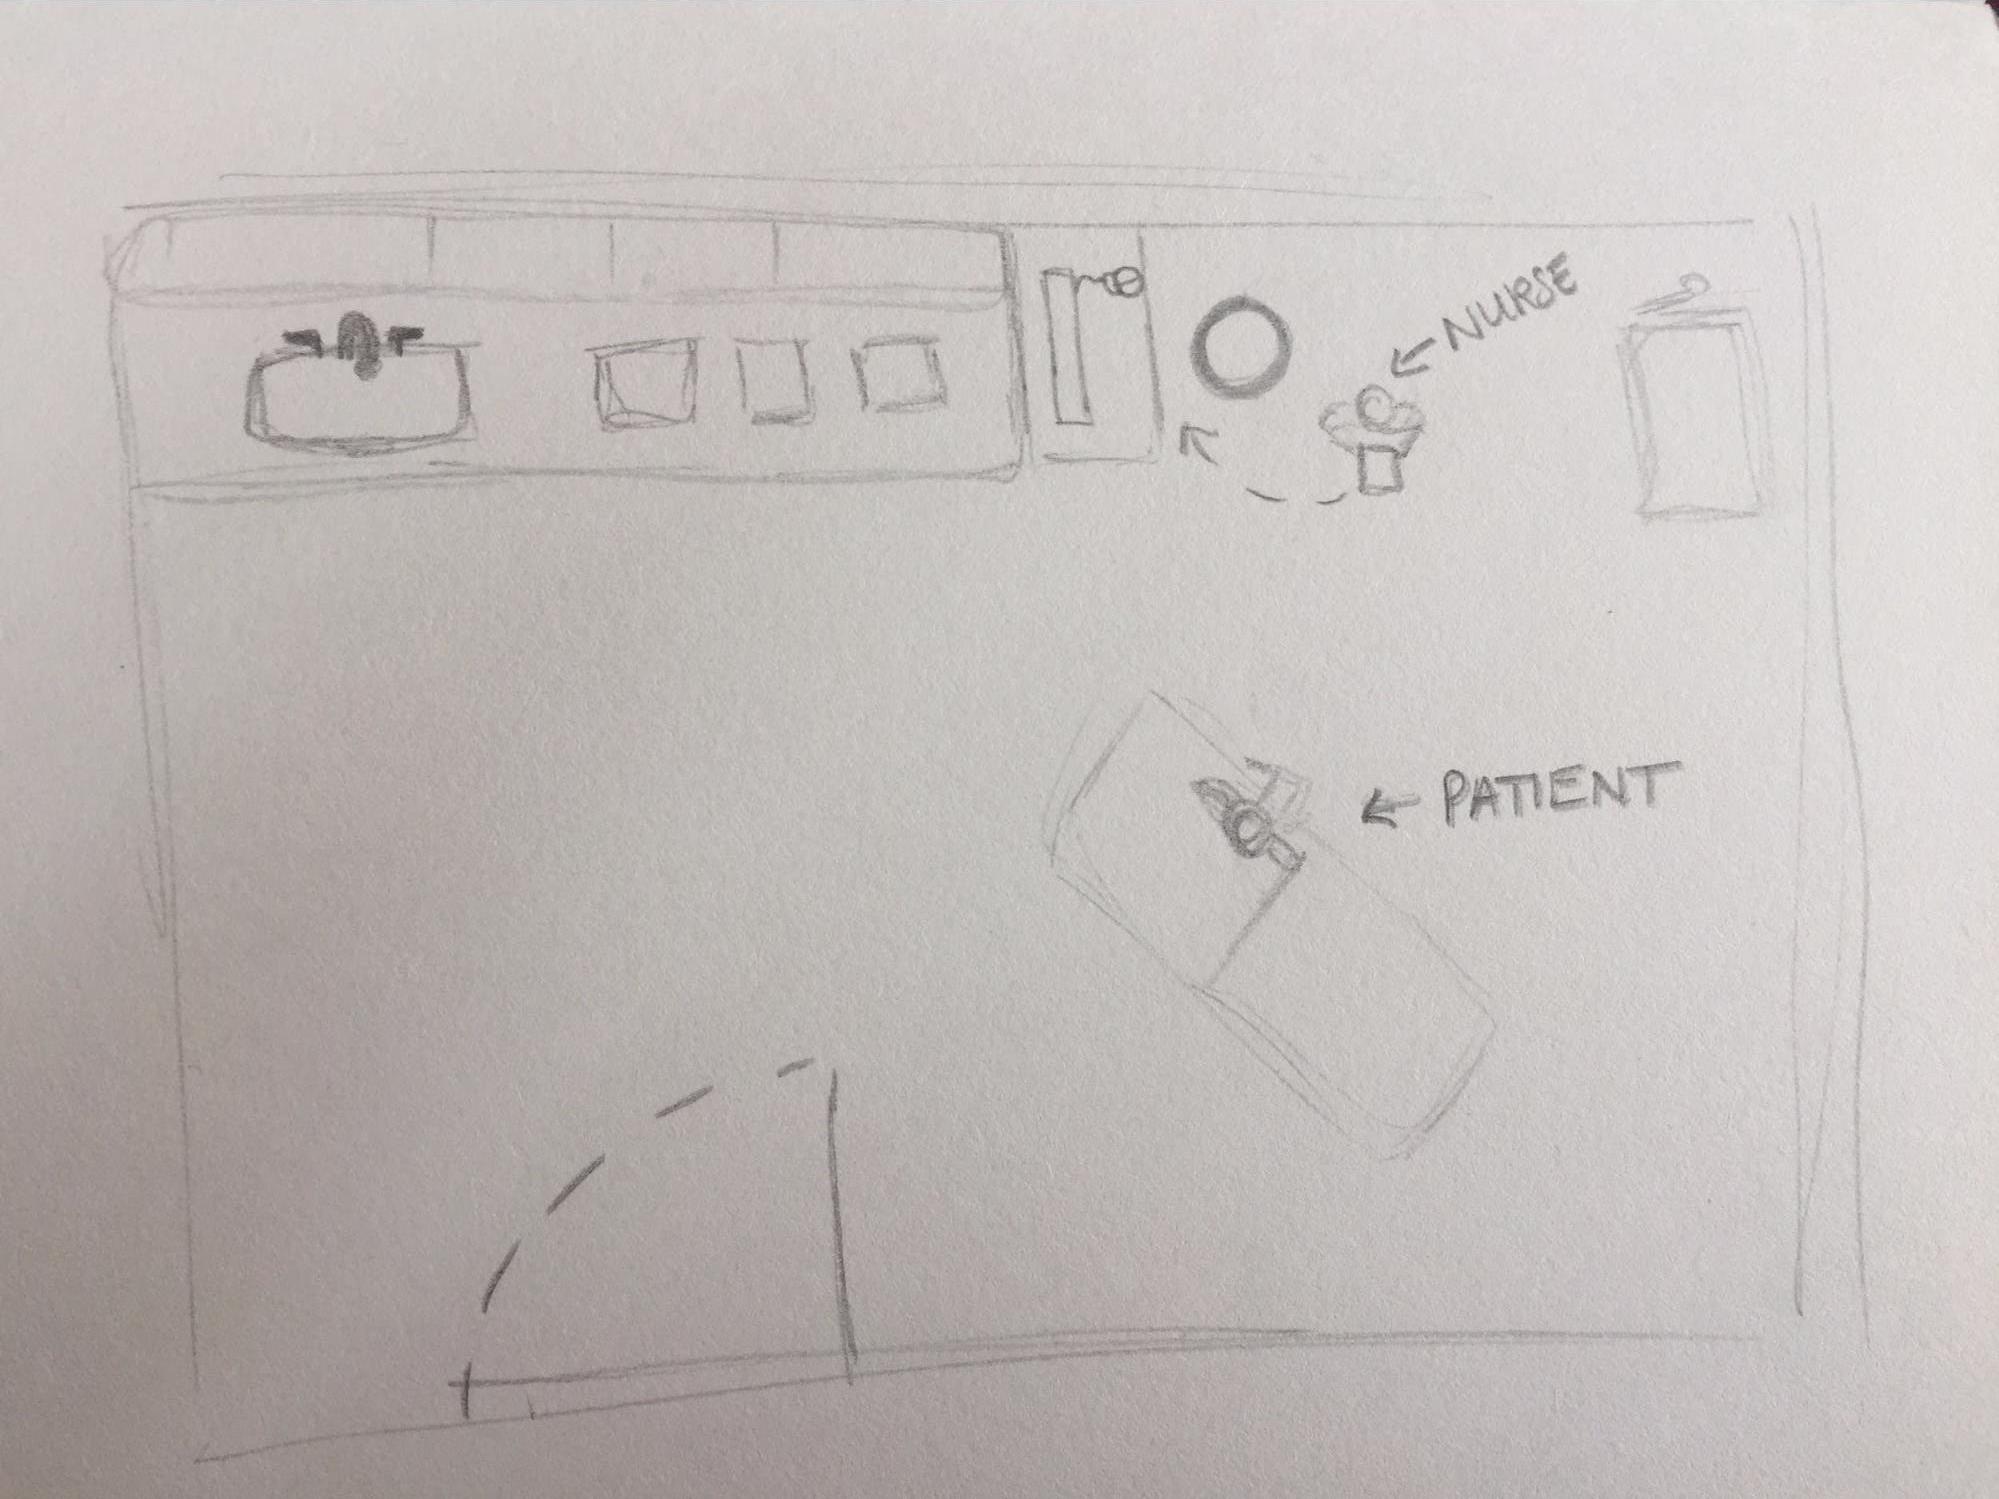
L: Nurse leaves and instructs patient that doctor will be in shortly (typically 5 - 20 min). During this time, patient either plays with mobile phone or walks around the room, viewing the space and examining brochures.
R: Doctor enters room and physically examines patient.
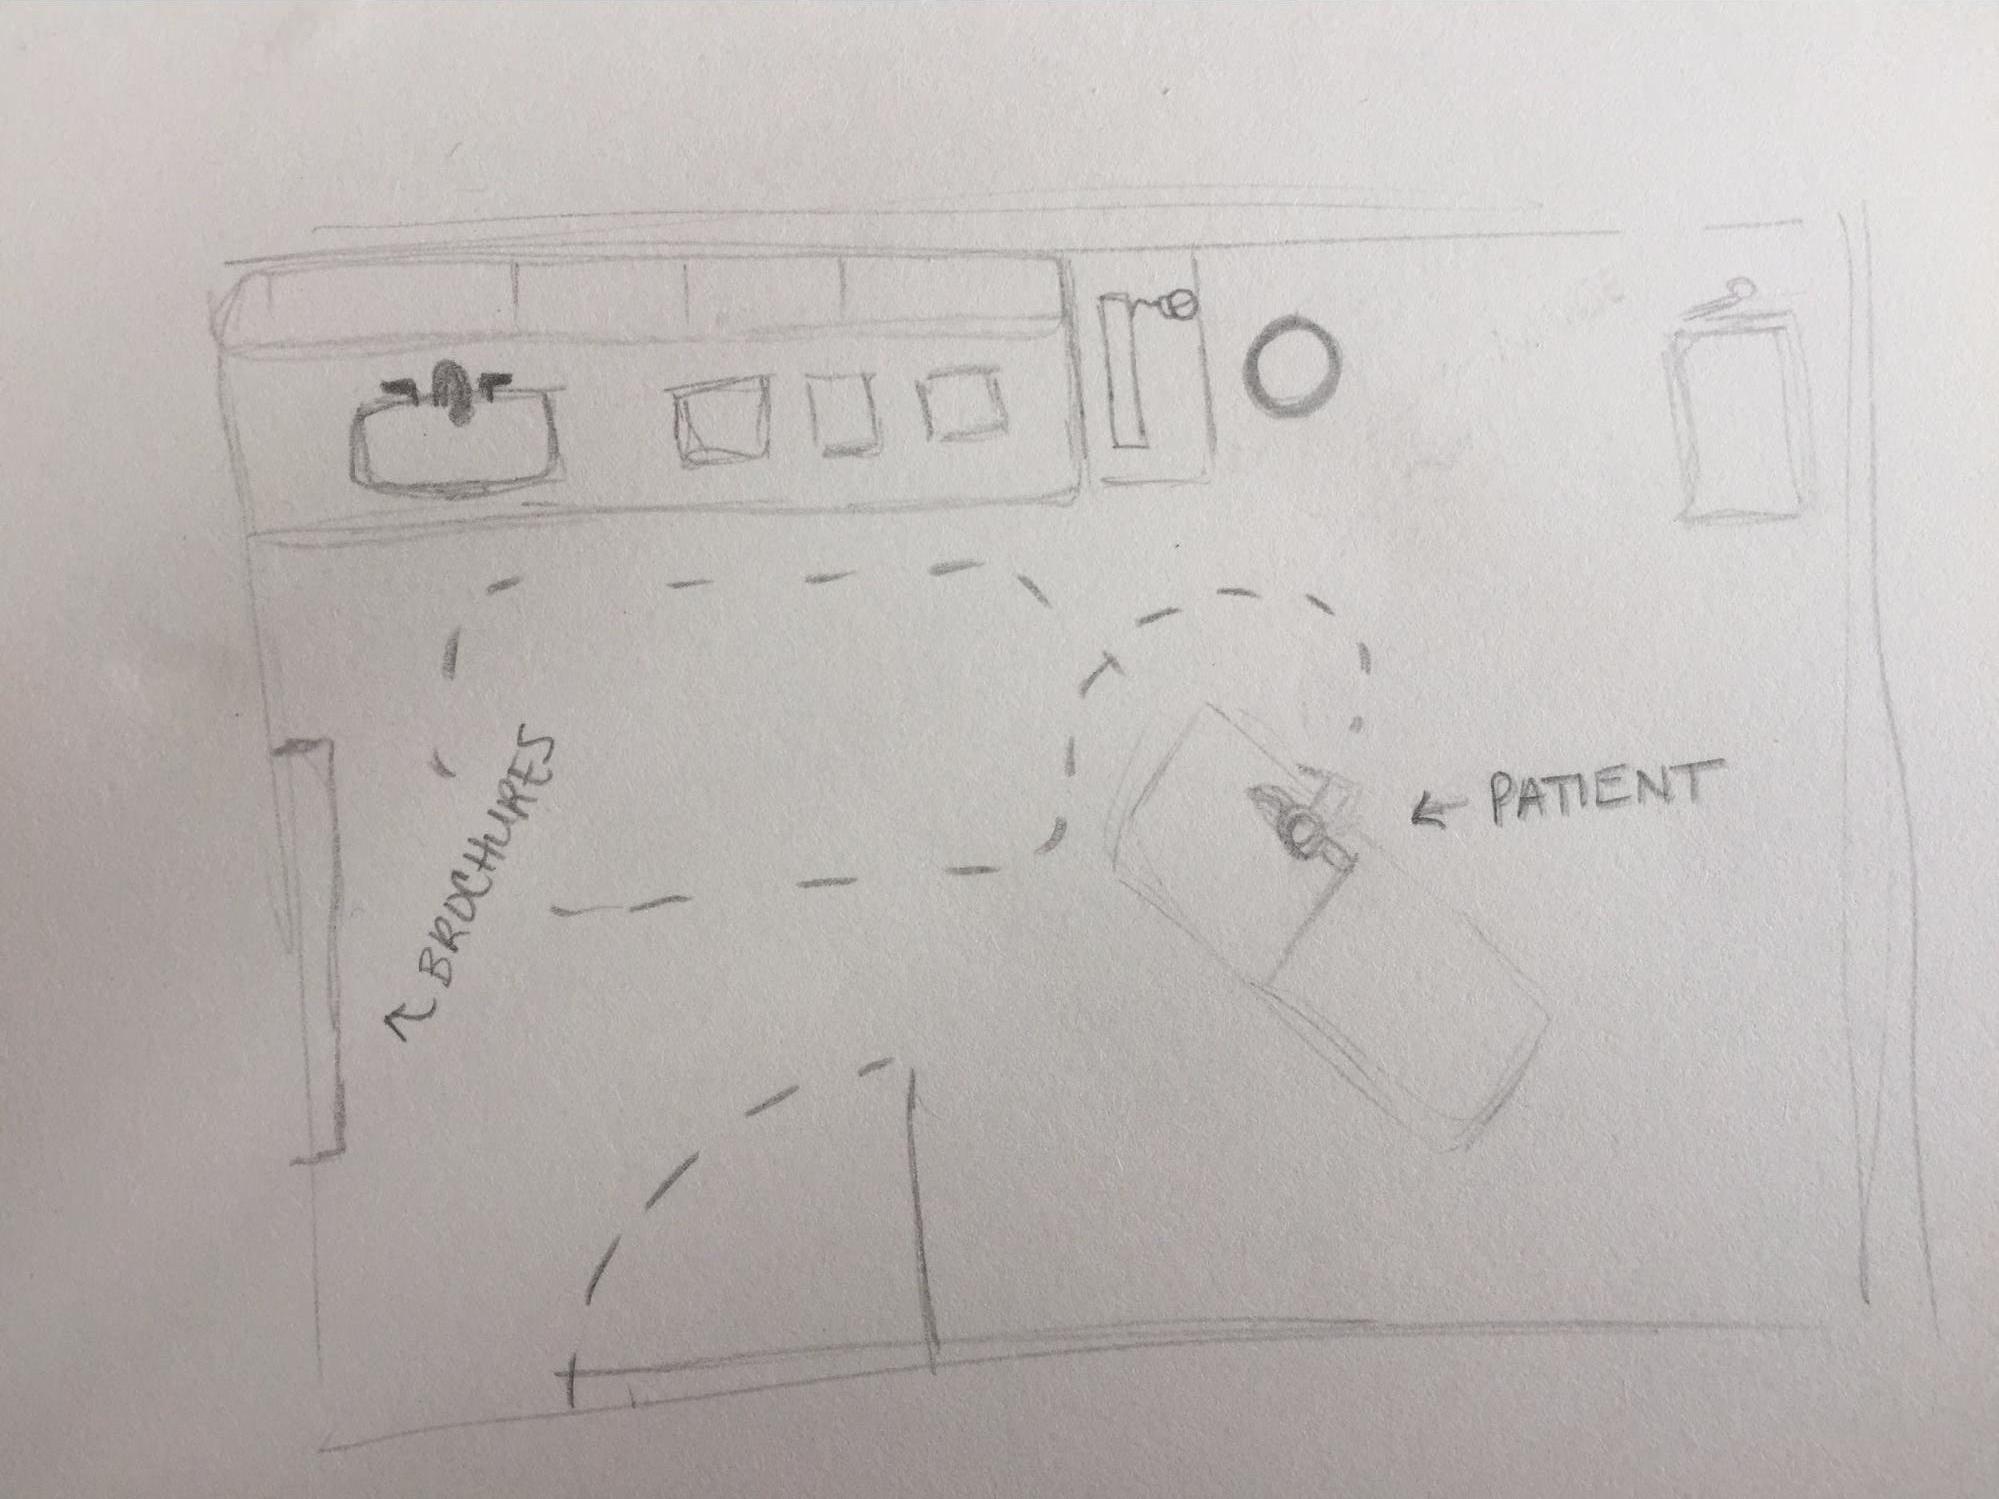
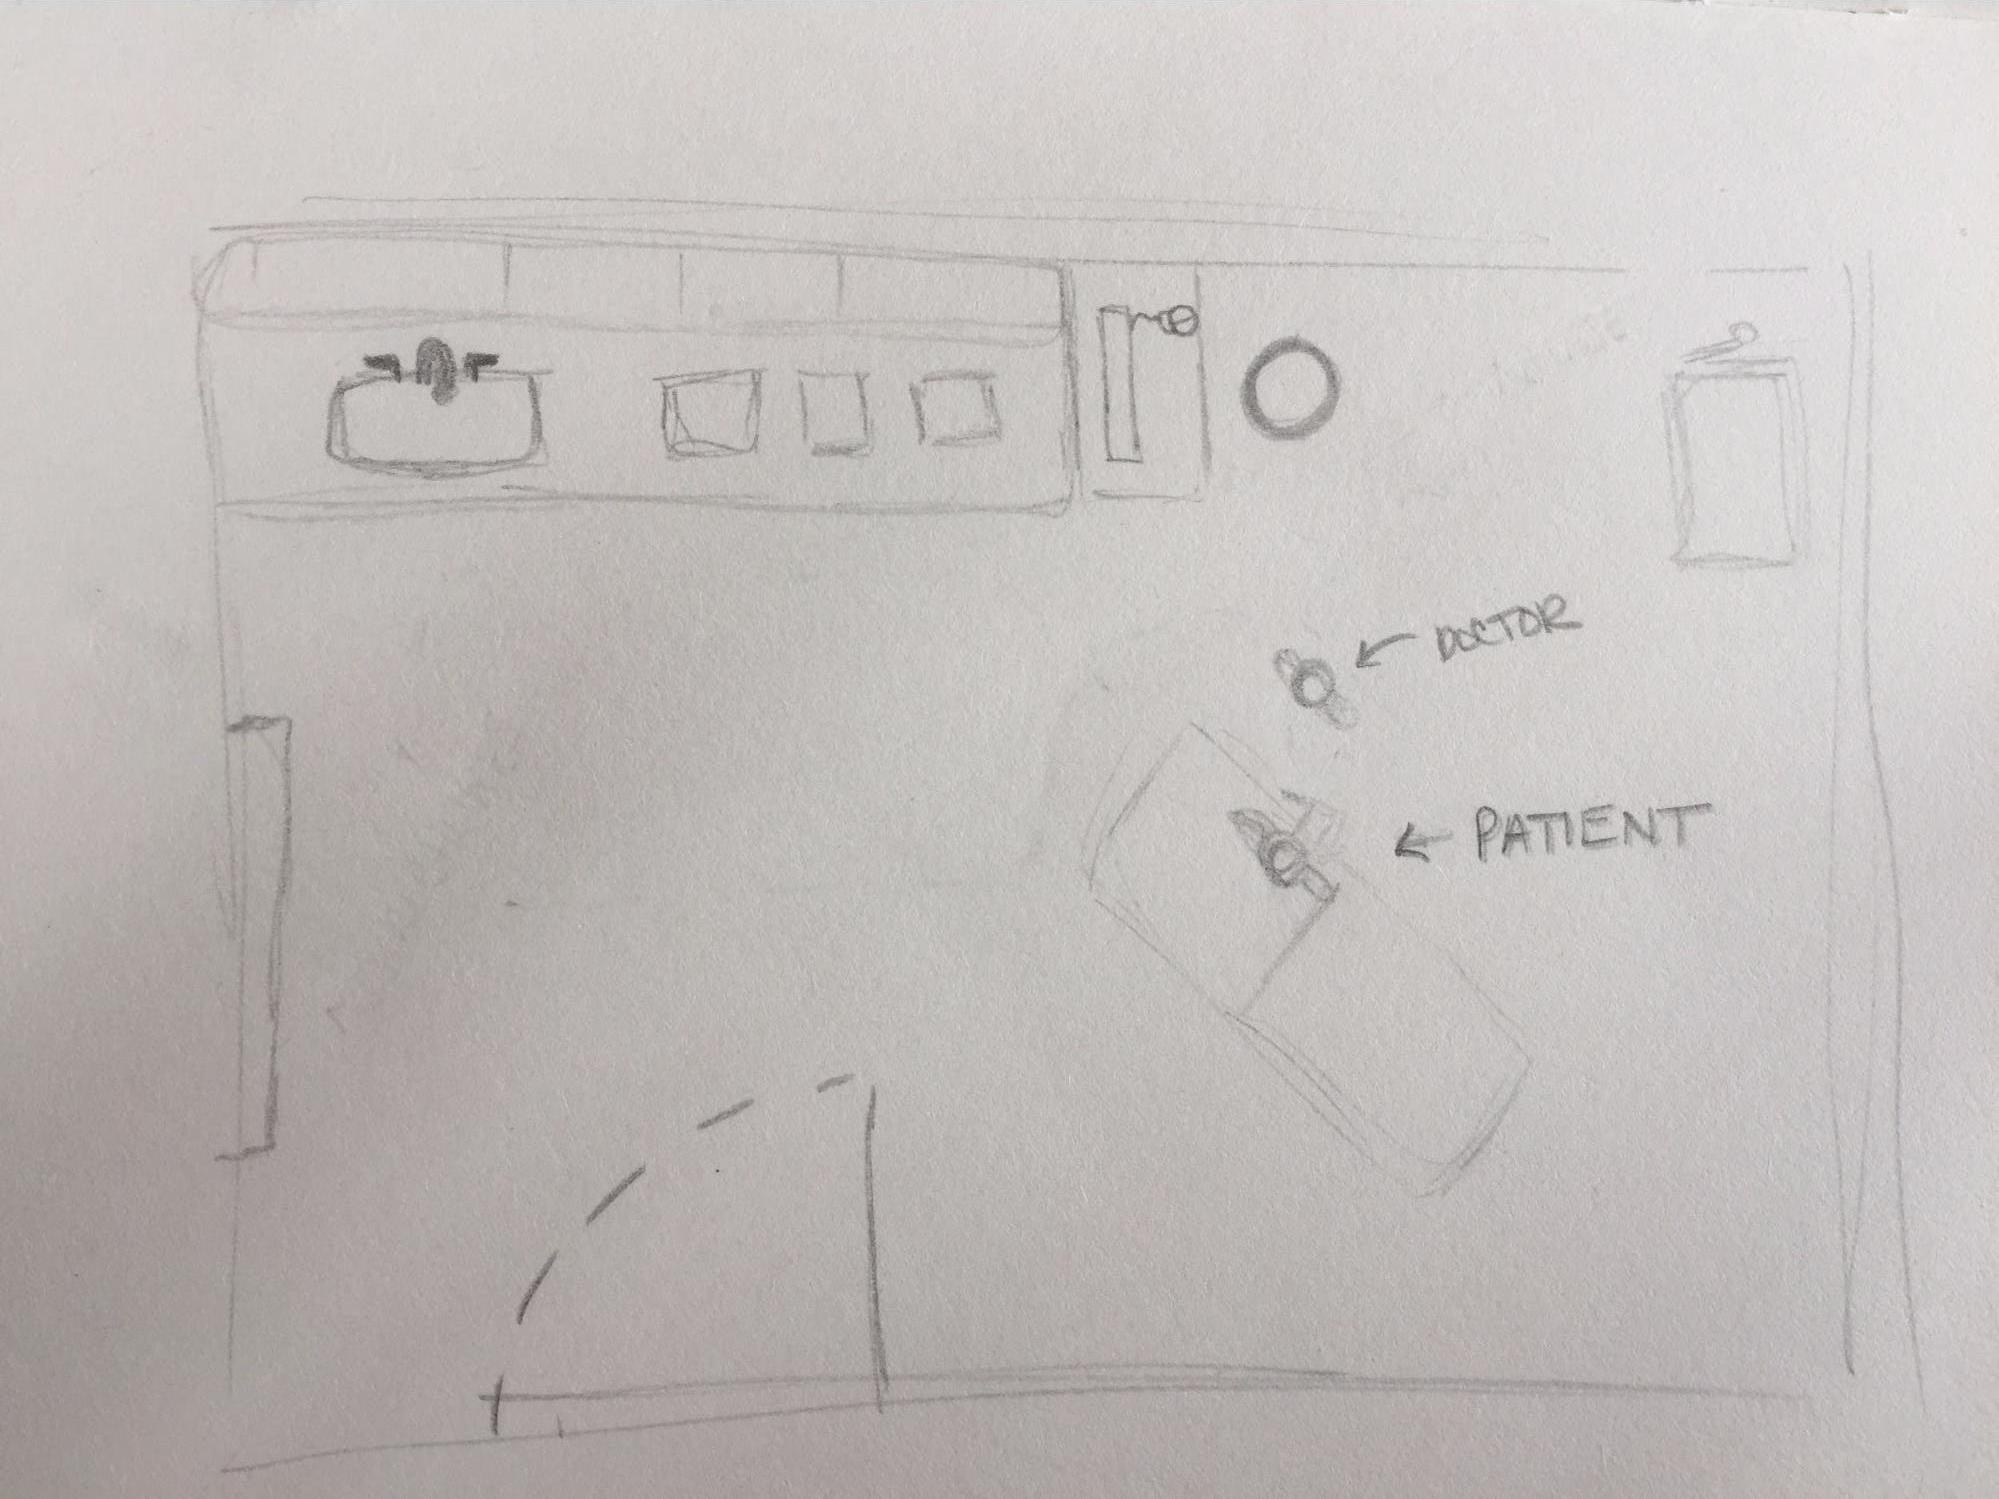
L: When finished with examination, doctor turns away from student and inputs information into desktop EHR system. If necessary, doctor can input any necessary prescriptions or follow-up recommendations.
R: The appointment concludes and student typically leaves with verbal information from doctor. Written information may come via EHR system or if doctor has provided an informational brochure from the room.
Survey
We ran a survey to gather initial user data to provided insight into what features are important to the users for technology that could enable data-discussions. Three questions from the nineteen asked in the survey and selected responses are provided below.
Question: Prior to your most recent visit, did you do any independent research about your health concern or reason for visiting? If so, what kind of research did you do? Please be as specific as you are comfortable being.
Googled the typical symptoms for the diagnosis I was given previously. I guess you could say I wanted a second opinion but I don’t want to go seek an additional doctor to give me. I was interested in seeing what the collective masses online had to say about my particular diagnosis.
I looked into studies on mental wellbeing to see if there were things I could do in my daily life to improve my wellbeing.
looked up potential at-home treatments
Question: Please share with us what made you feel uncomfortable/comfortable sharing or disclosing information with your physician. Please be as specific as you are comfortable being.
This was not their first rodeo, capable hands… And you know… Med school.
it was a doctor I had been to before, who I like, so I think that made me more comfortable sharing information
It can be really hard to disclose information to my doctor, even though I know they are trained professionals, I still fear I am being judged for what I have to say or how I feel. I am also very afraid of sounding stupid. Usually after talking for a little while, its easier for me to open up and talk without concern.
Question: Using the following scale, what percentage of your questions or concerns do you feel were addressed during your last visit (e.g. 0% = None of my concerns, 50% = Half of my concerns, 100% = All of my concerns)? Why did you indicate this percentage in the previous question? For example, did you feel that your questions and concerns were answered fully or ignored? Please be as specific as you are comfortable being.
81%. There is inherent guesswork in medicine, they didn’t really hit on all the symptoms I had.
85%. I was given a diagnosis which appears to have explained a majority of the concerns I had. Everything else is just kind of personal problems I suppose. I am not entirely sure though. I think I would like to bring up more questions or thoughts, but sometimes it feels like there is no room in the discussion with my doctor to talk about these things.
100%. They answered all questions I had, and I had no problems in the following weeks as I was treating my issue, indicating that any information they gave me was at least sufficient for what I needed to know.
Some Takeaways
- Confidence/trust in doctor’s diagnosis and opinion.
- Interest in personal data.
- Lack of data-driven information during visits.
- The barriers of convention and constraints.
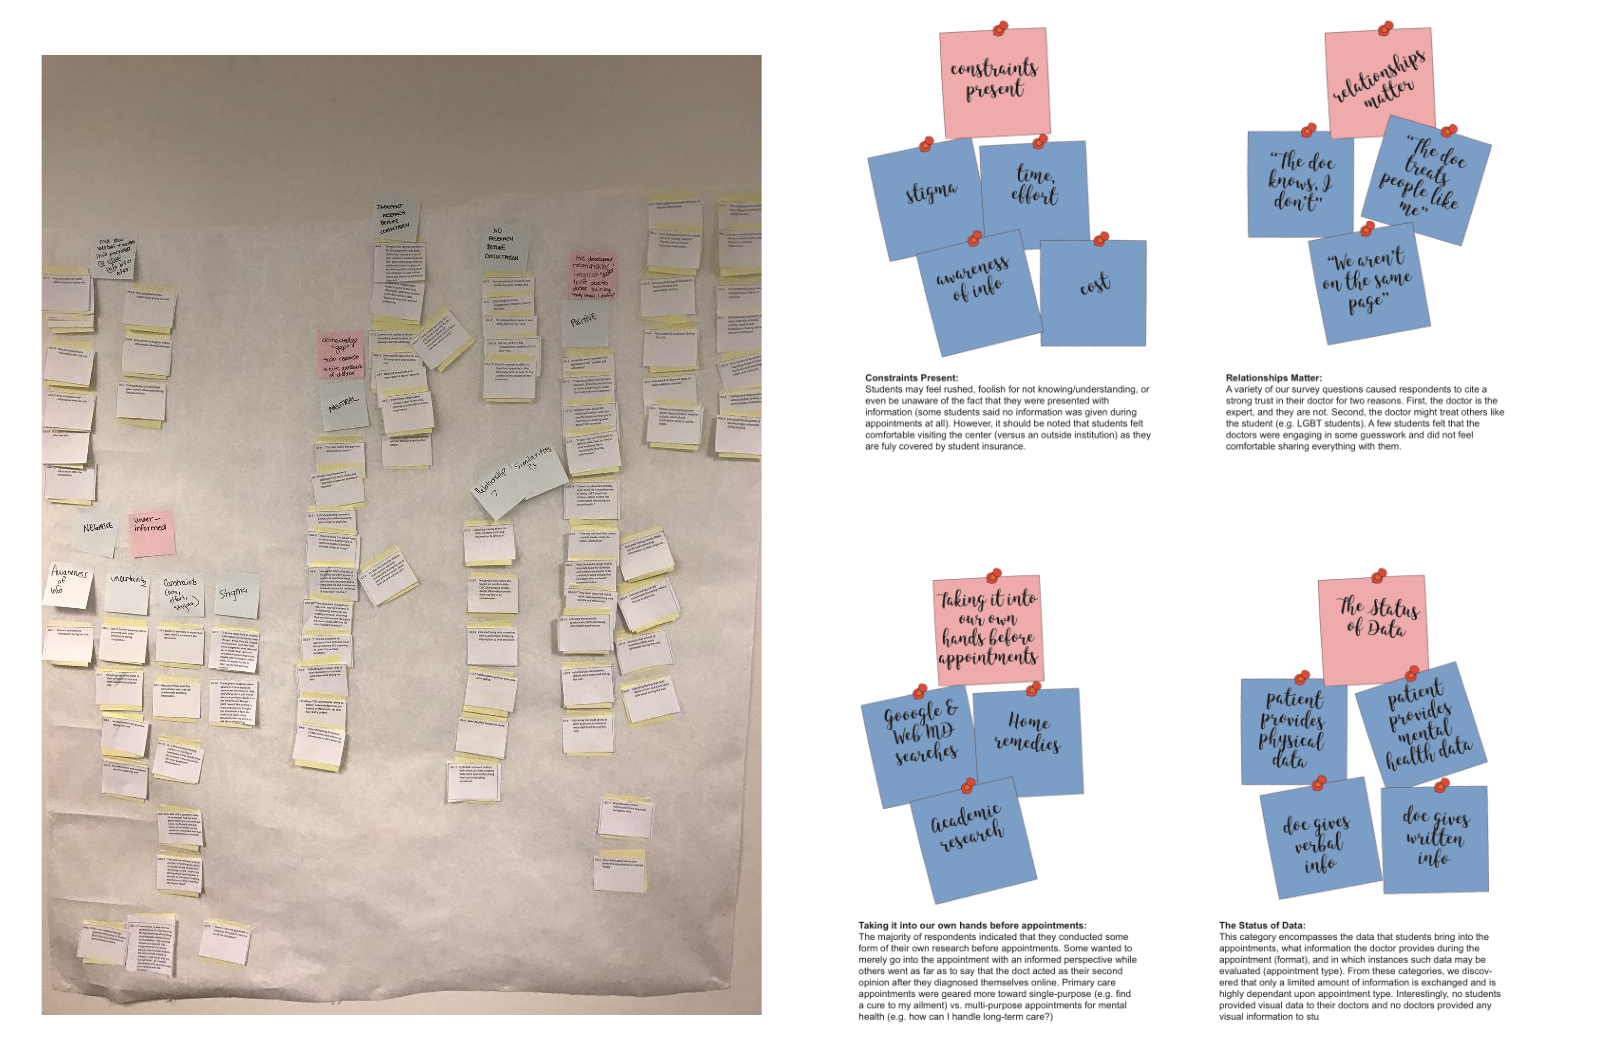
Affinity Diagramming
After we gathered initial user research data, we made a paper affinity diagram (left) to construct themes and related concepts from a bottom-up approach. We later focused our findings into high-level categories via a digital revised version (right).
Diverging
Our team then set out to create many different ideas for a technology or device that could meet our discovered user needs.
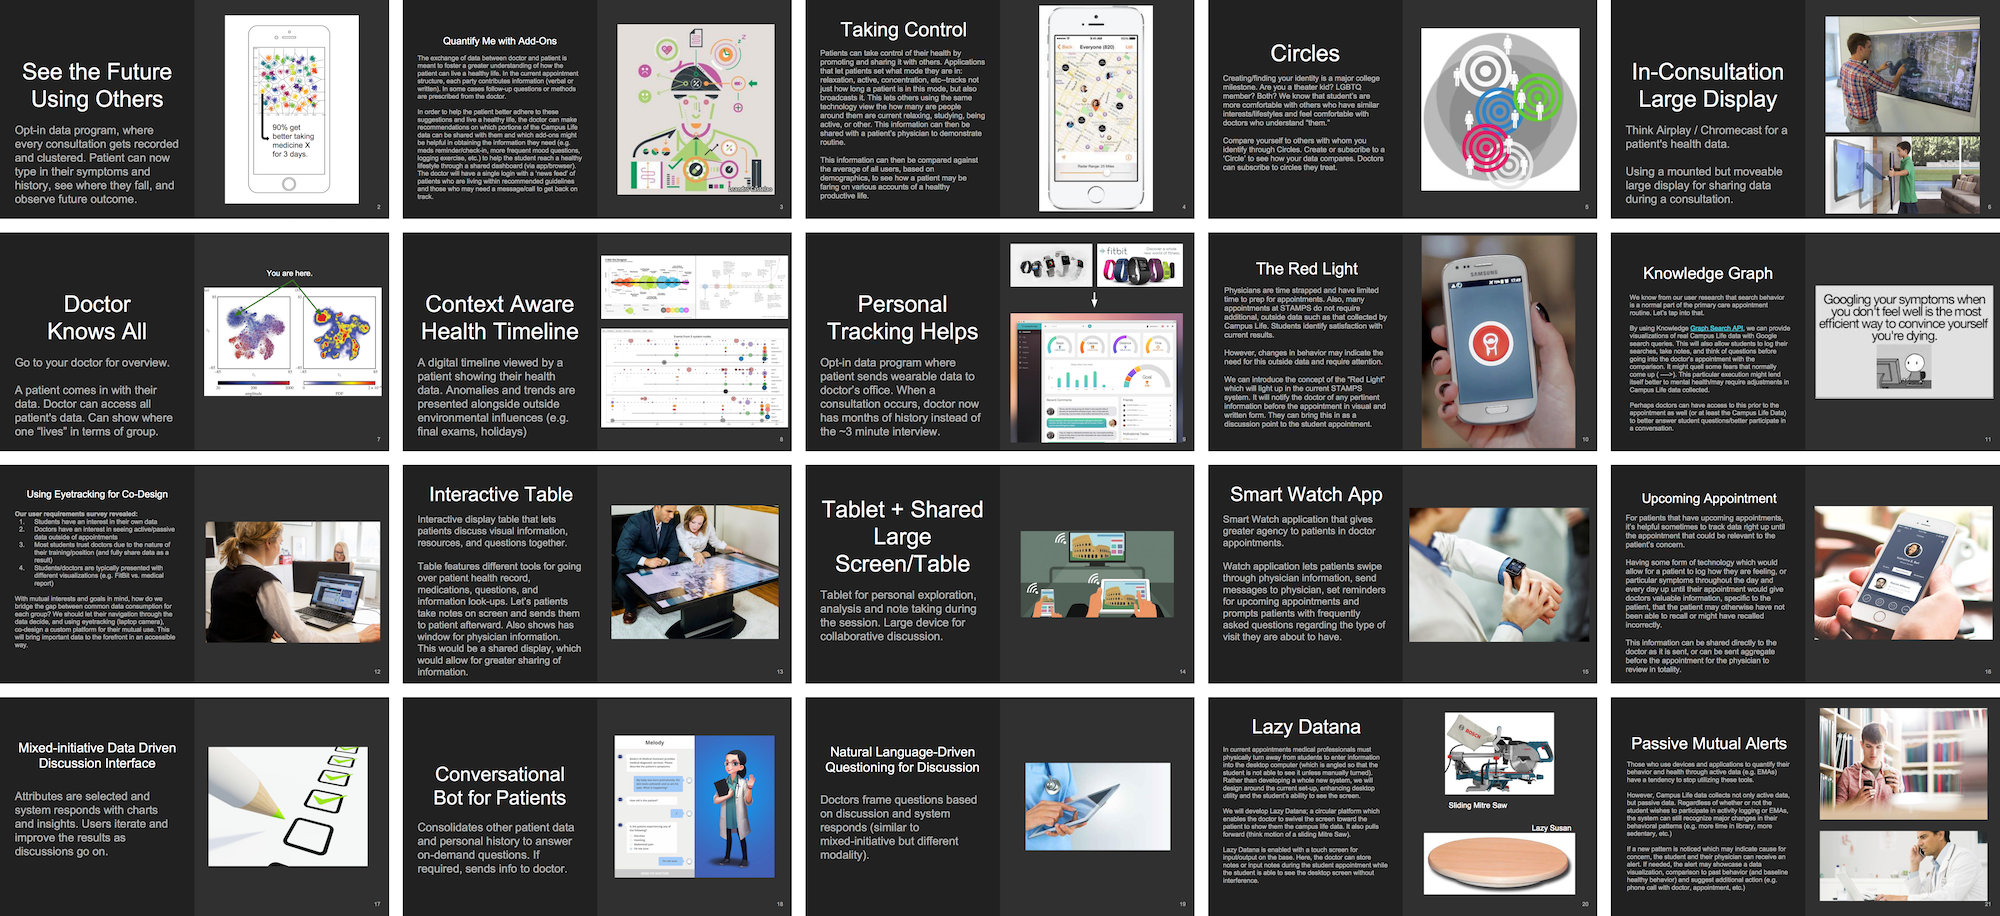
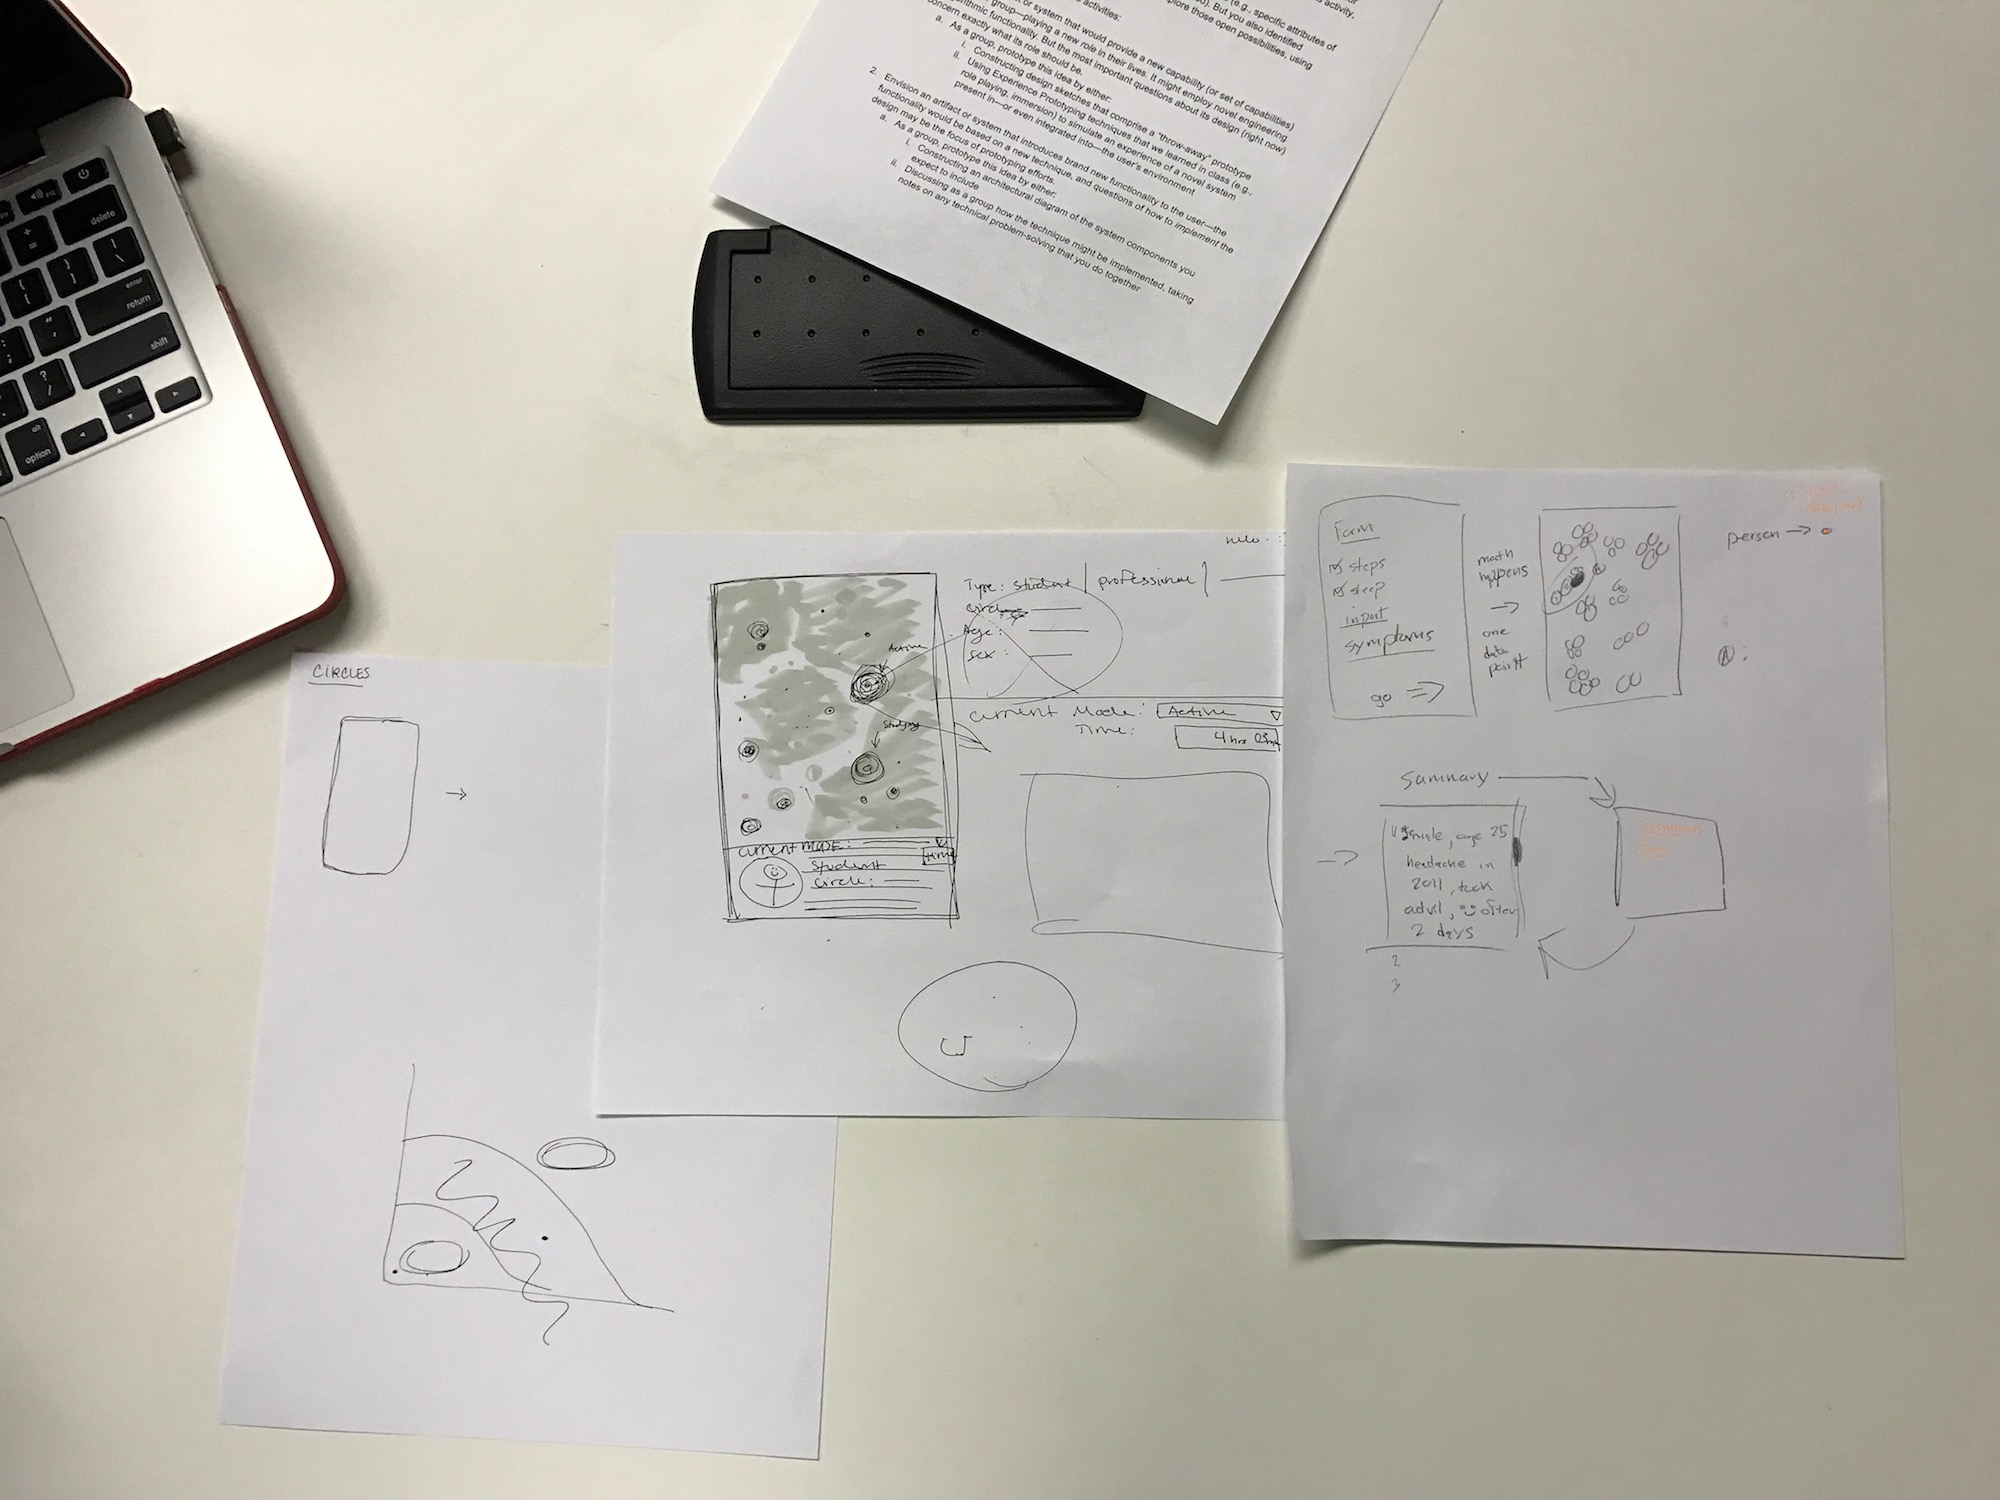
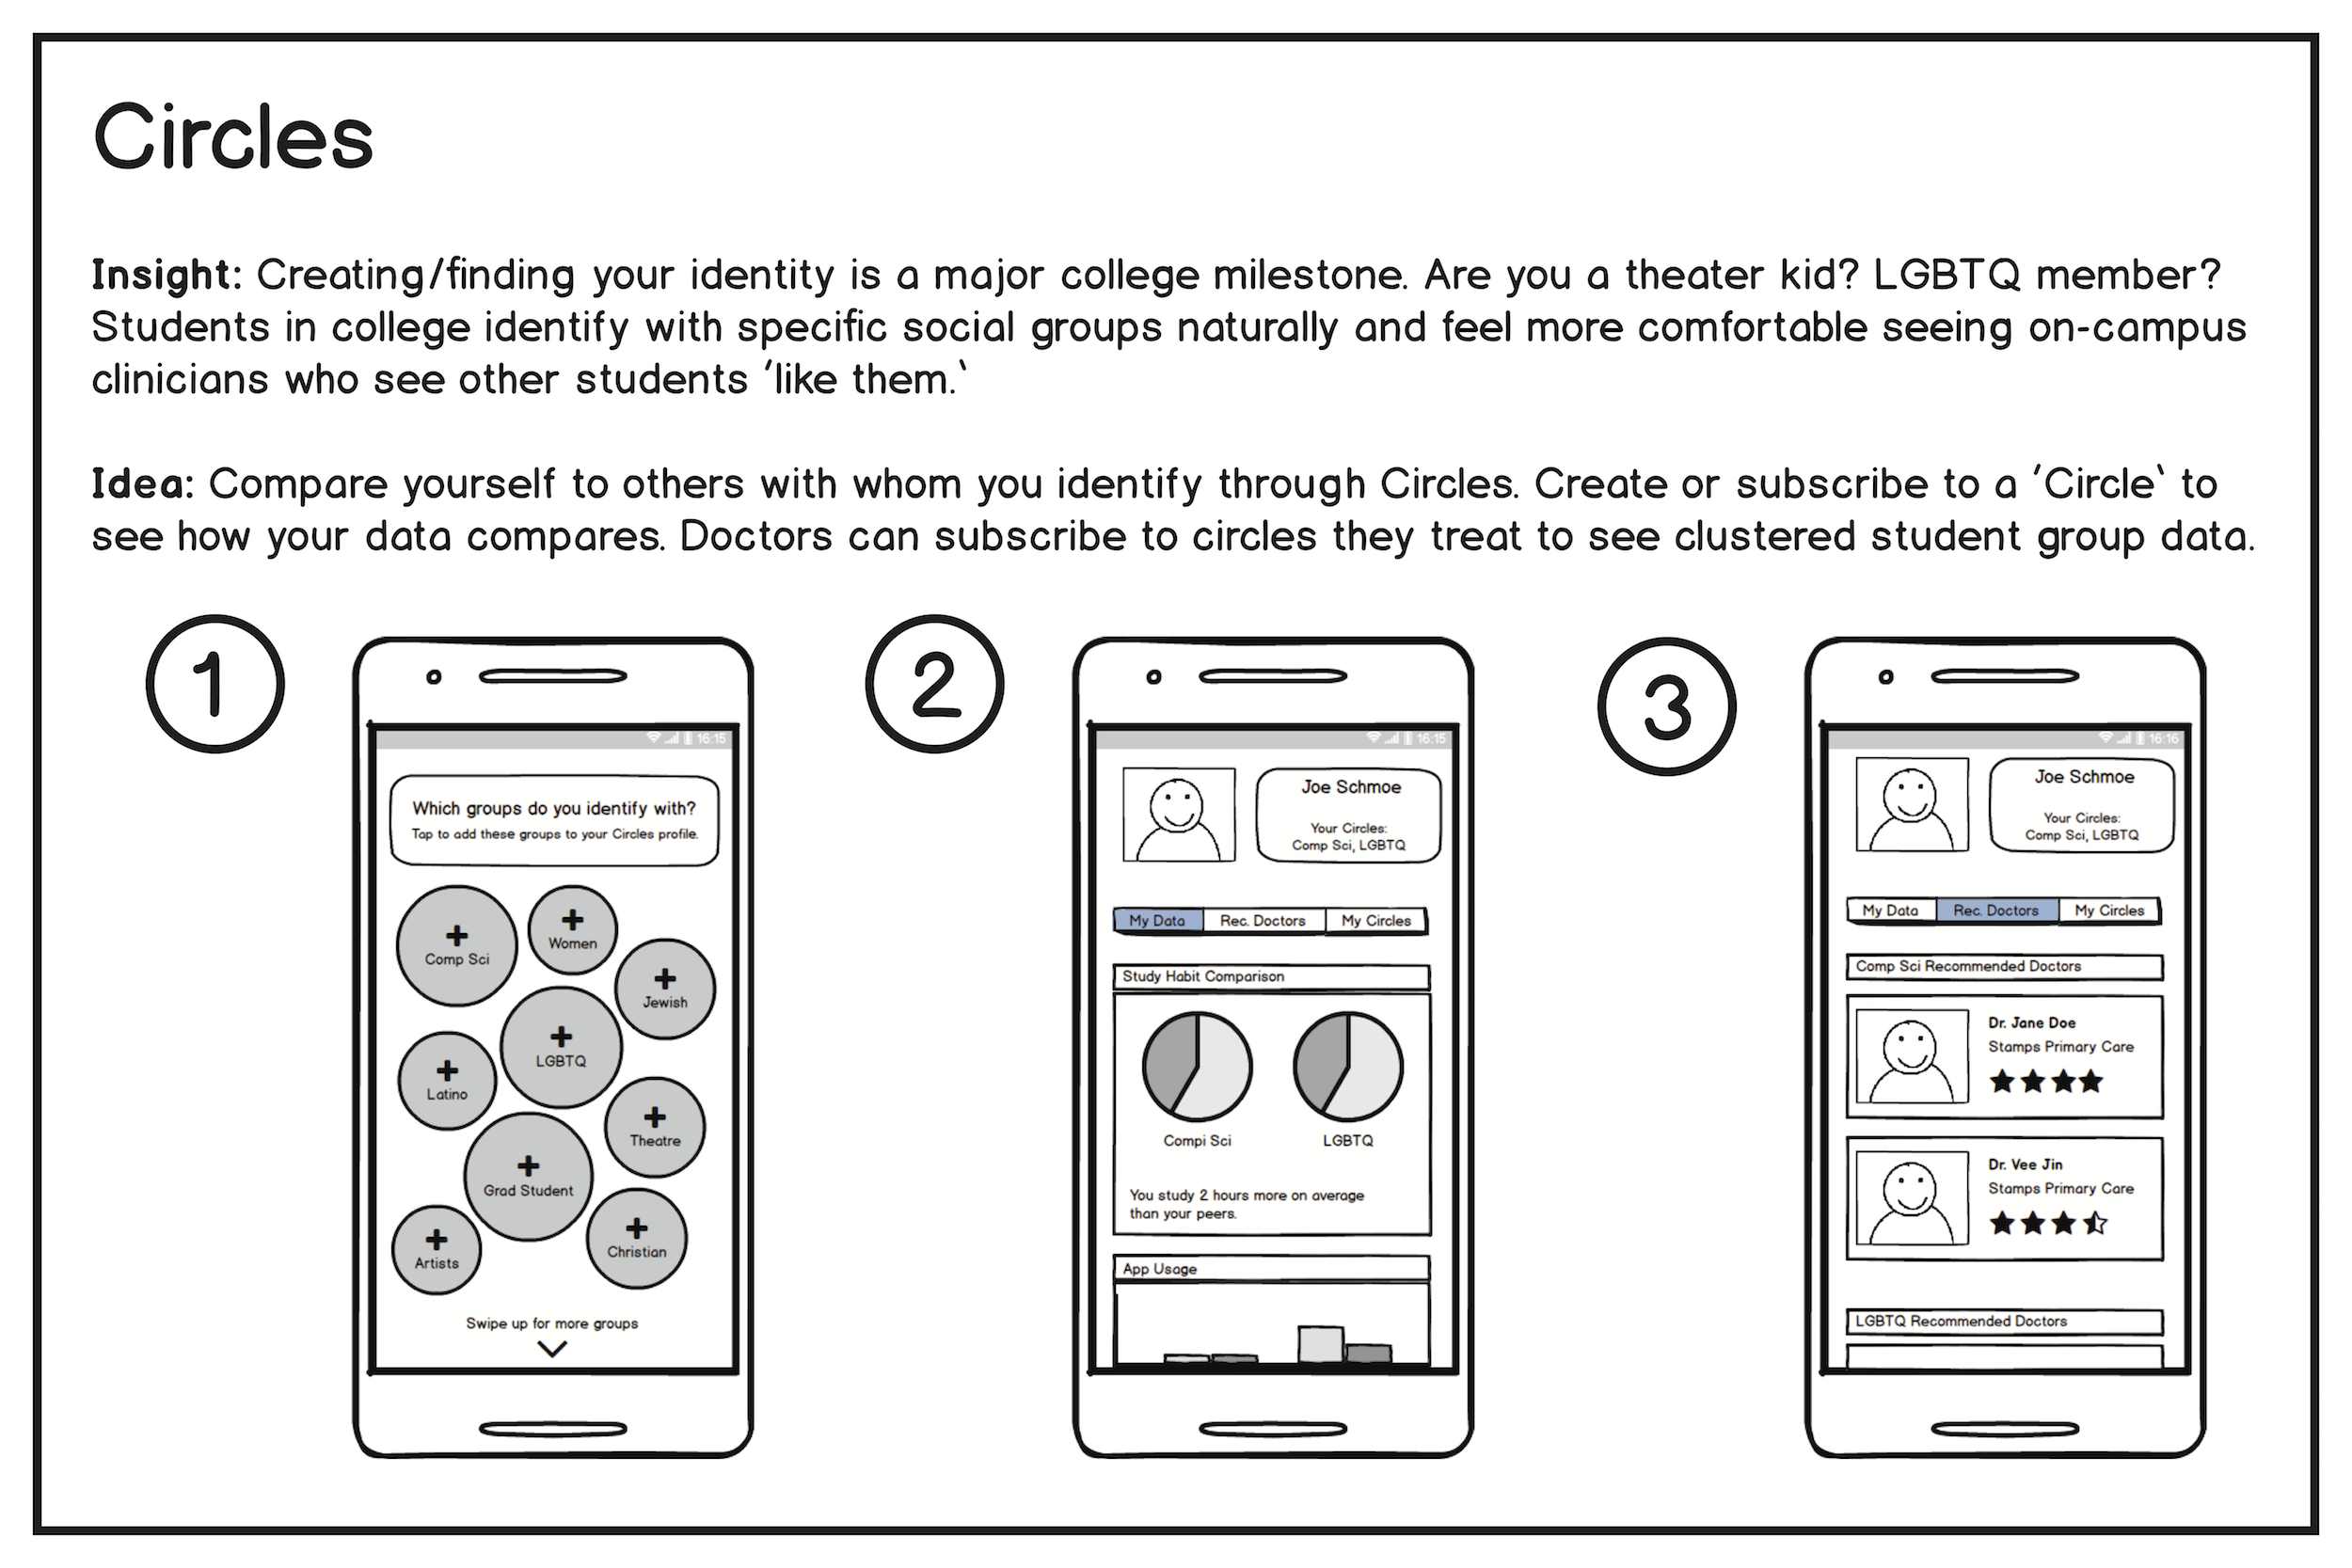
Low Fidelity Prototypes
From these ideas, we chose a subset of three ideas that we thought best captured user needs and could be further refined into a new capable technology.
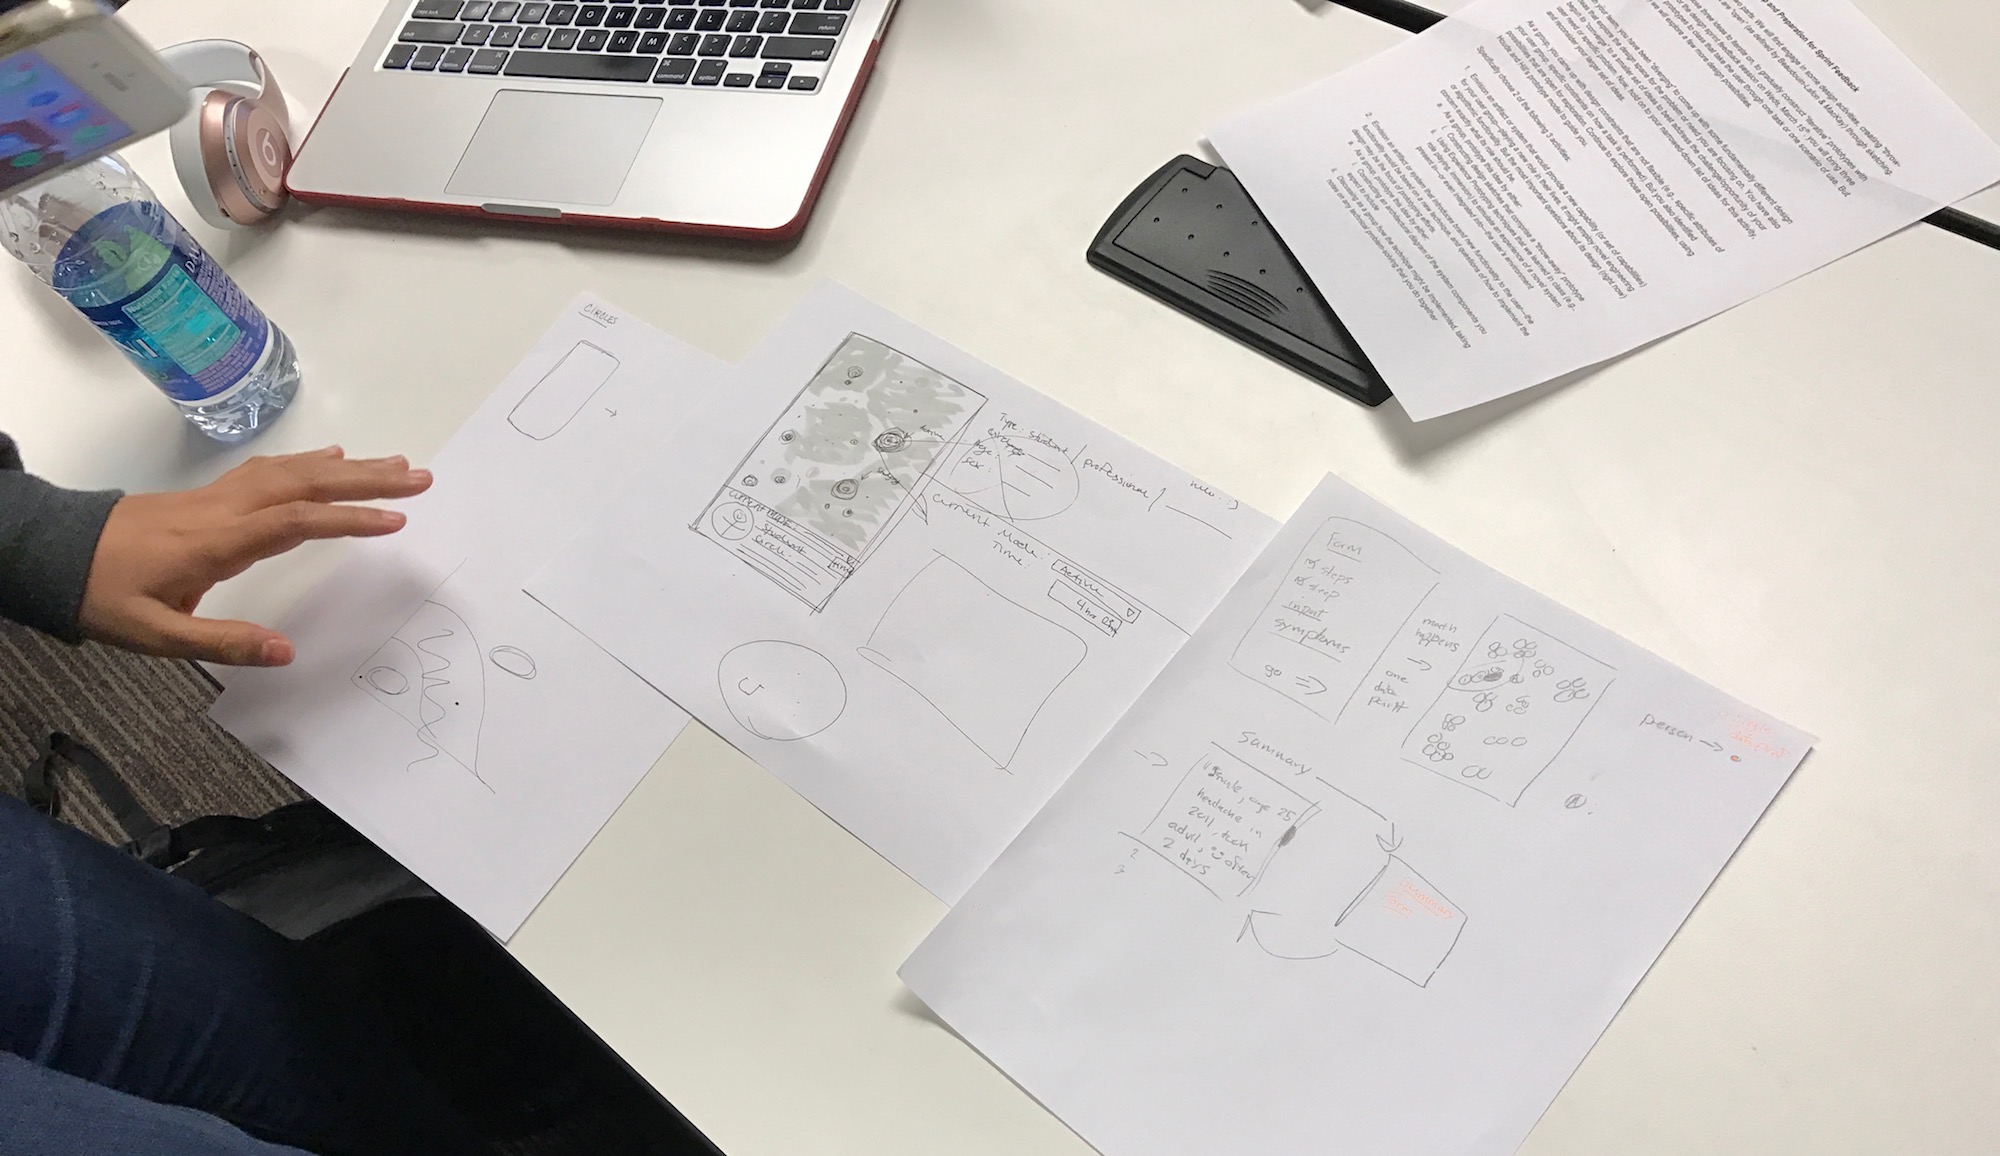
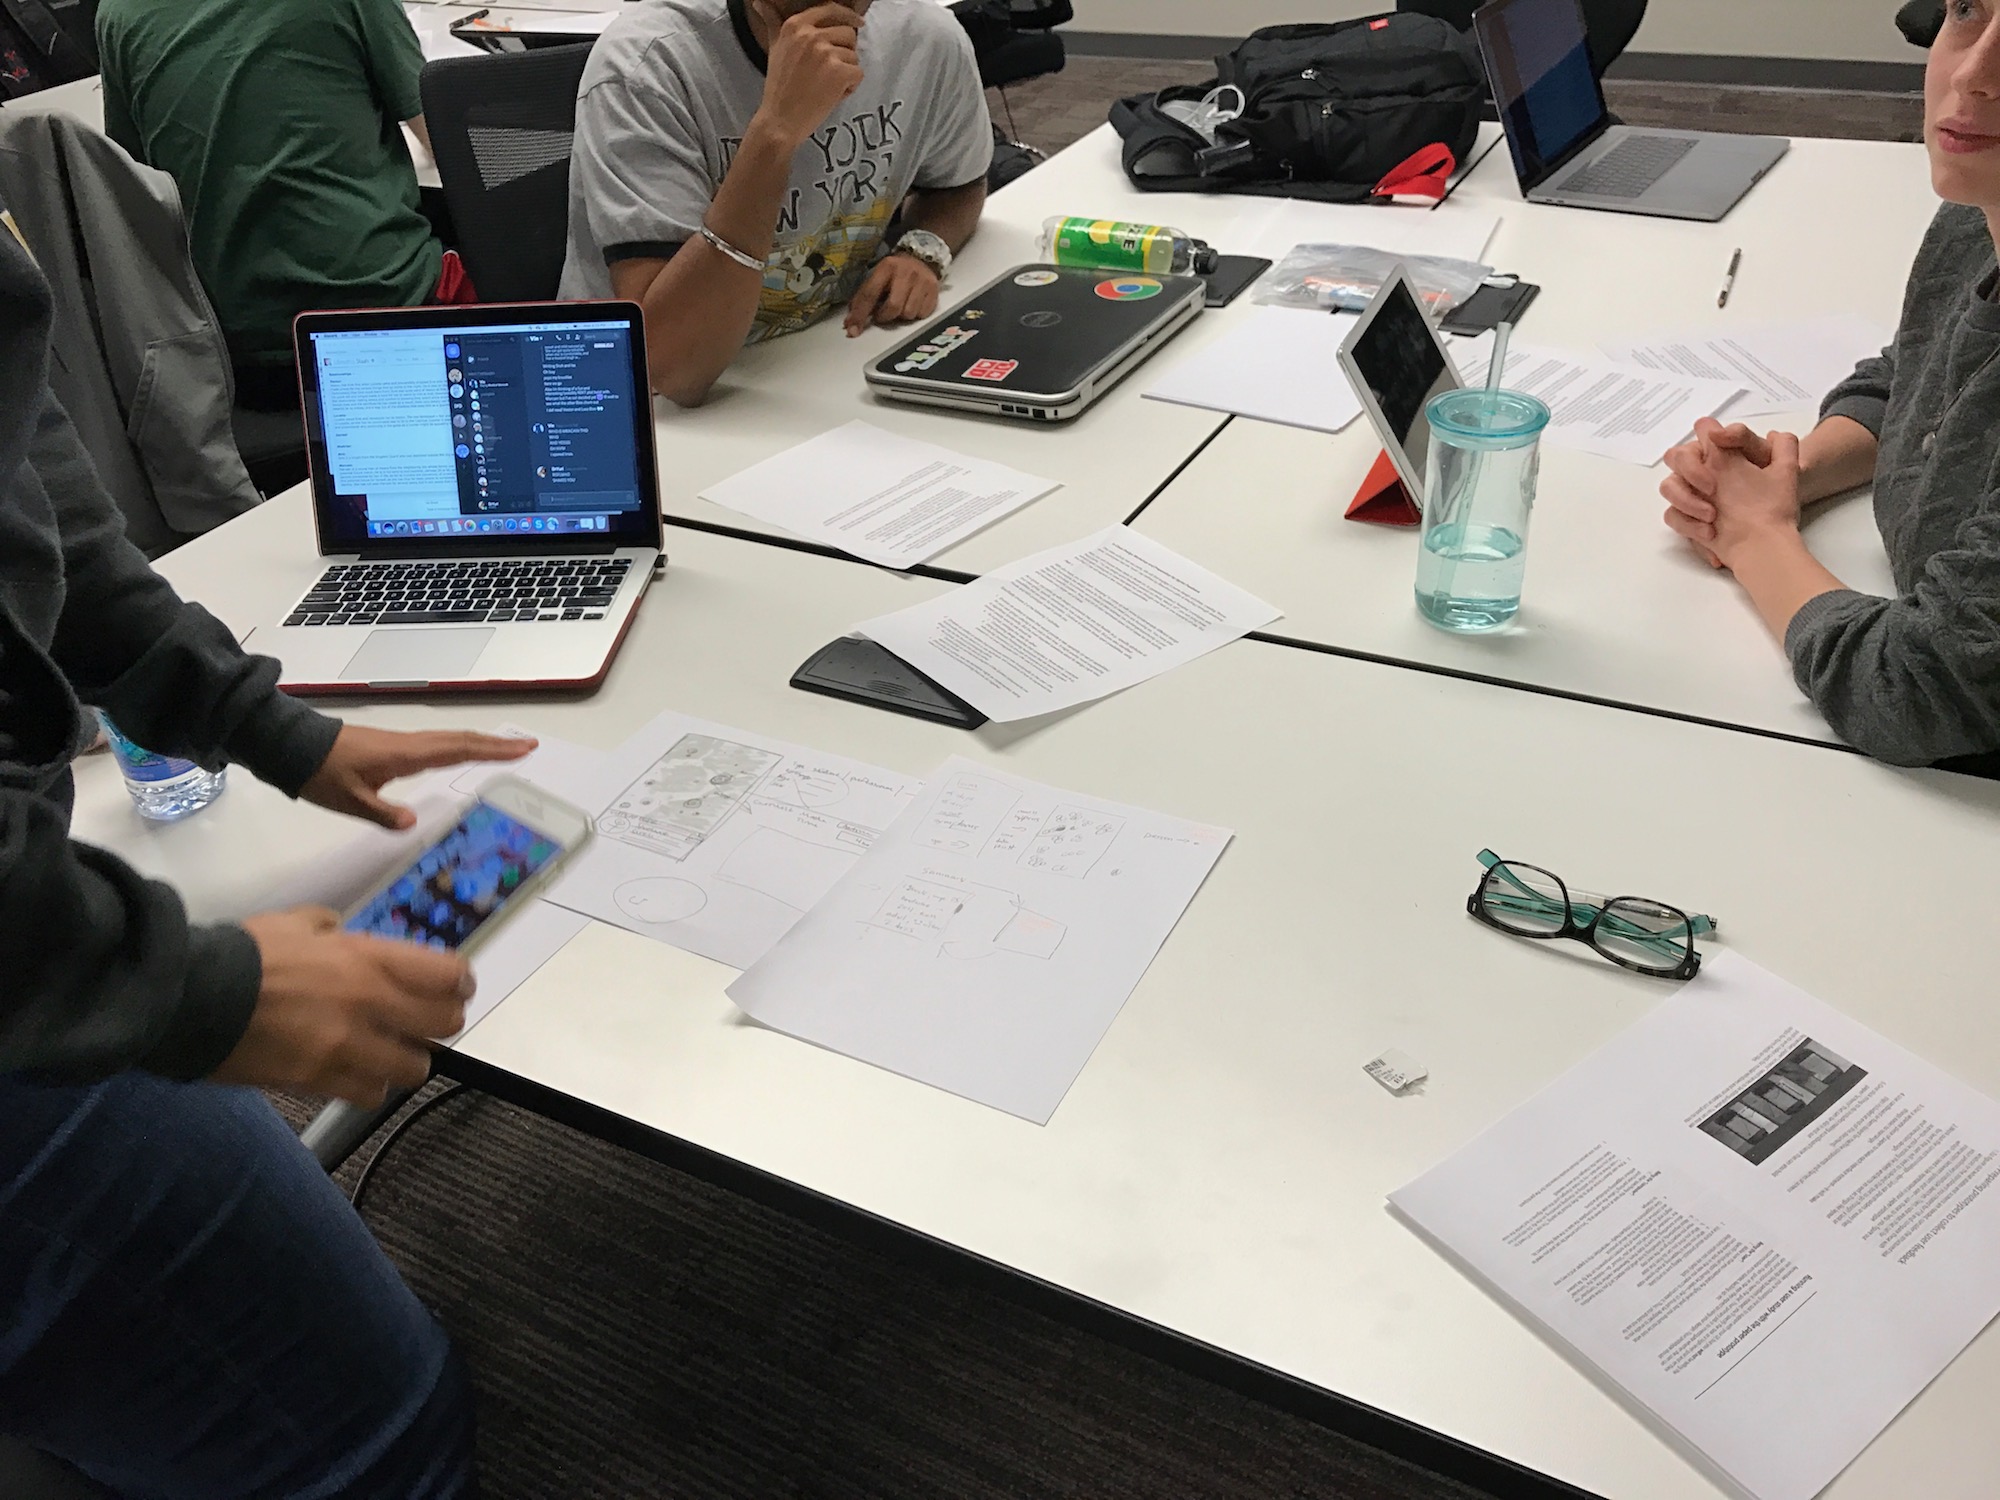
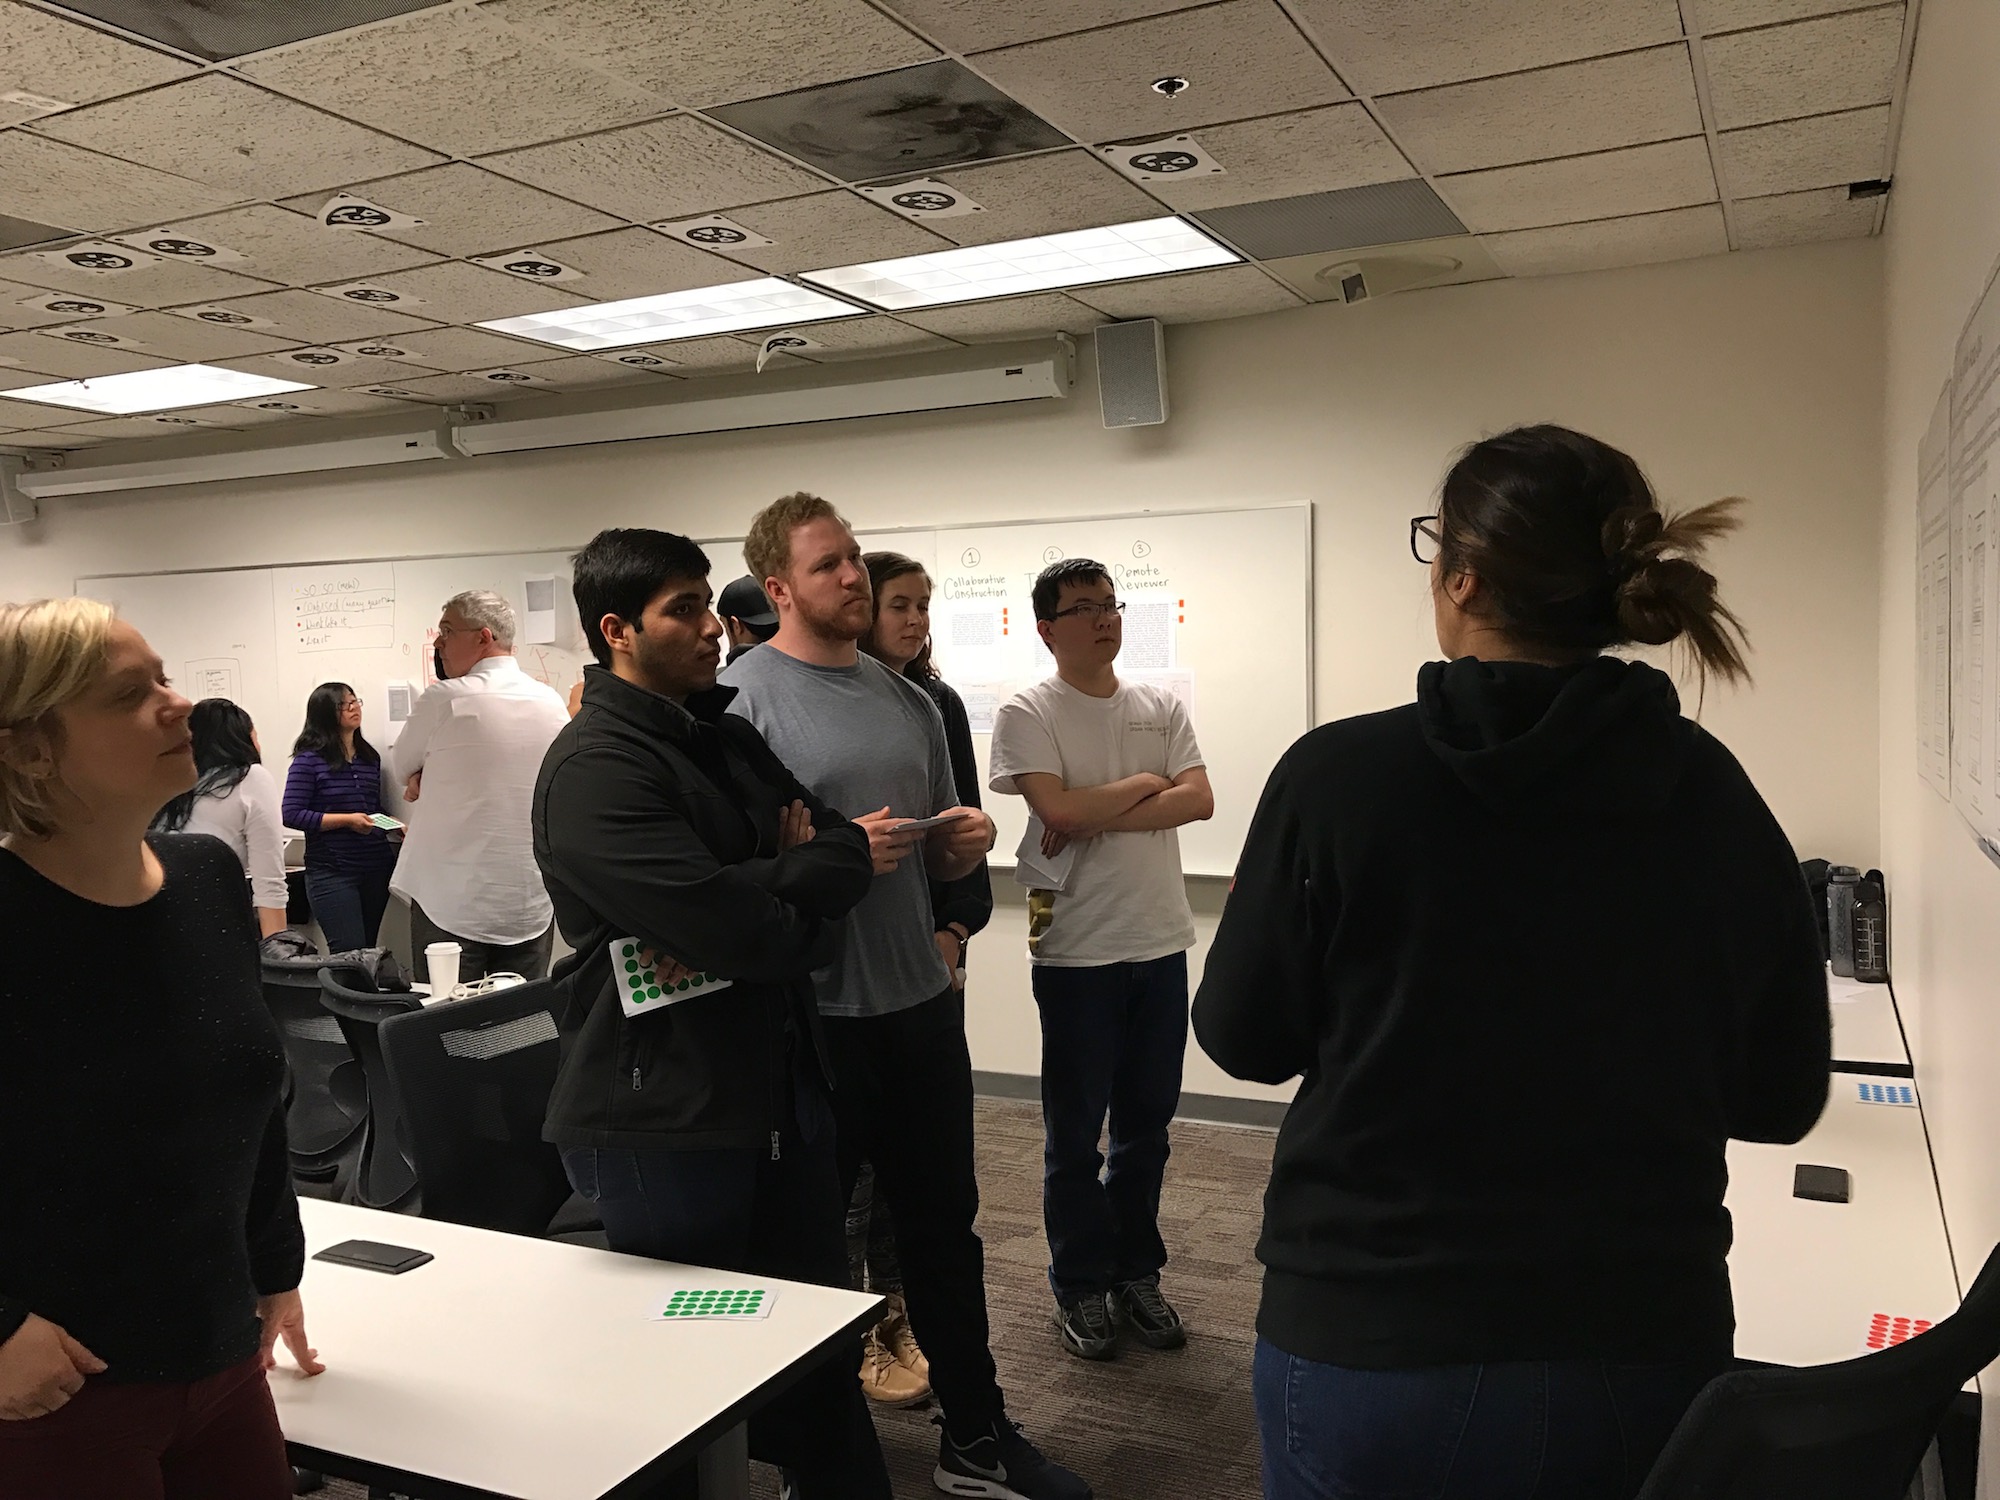
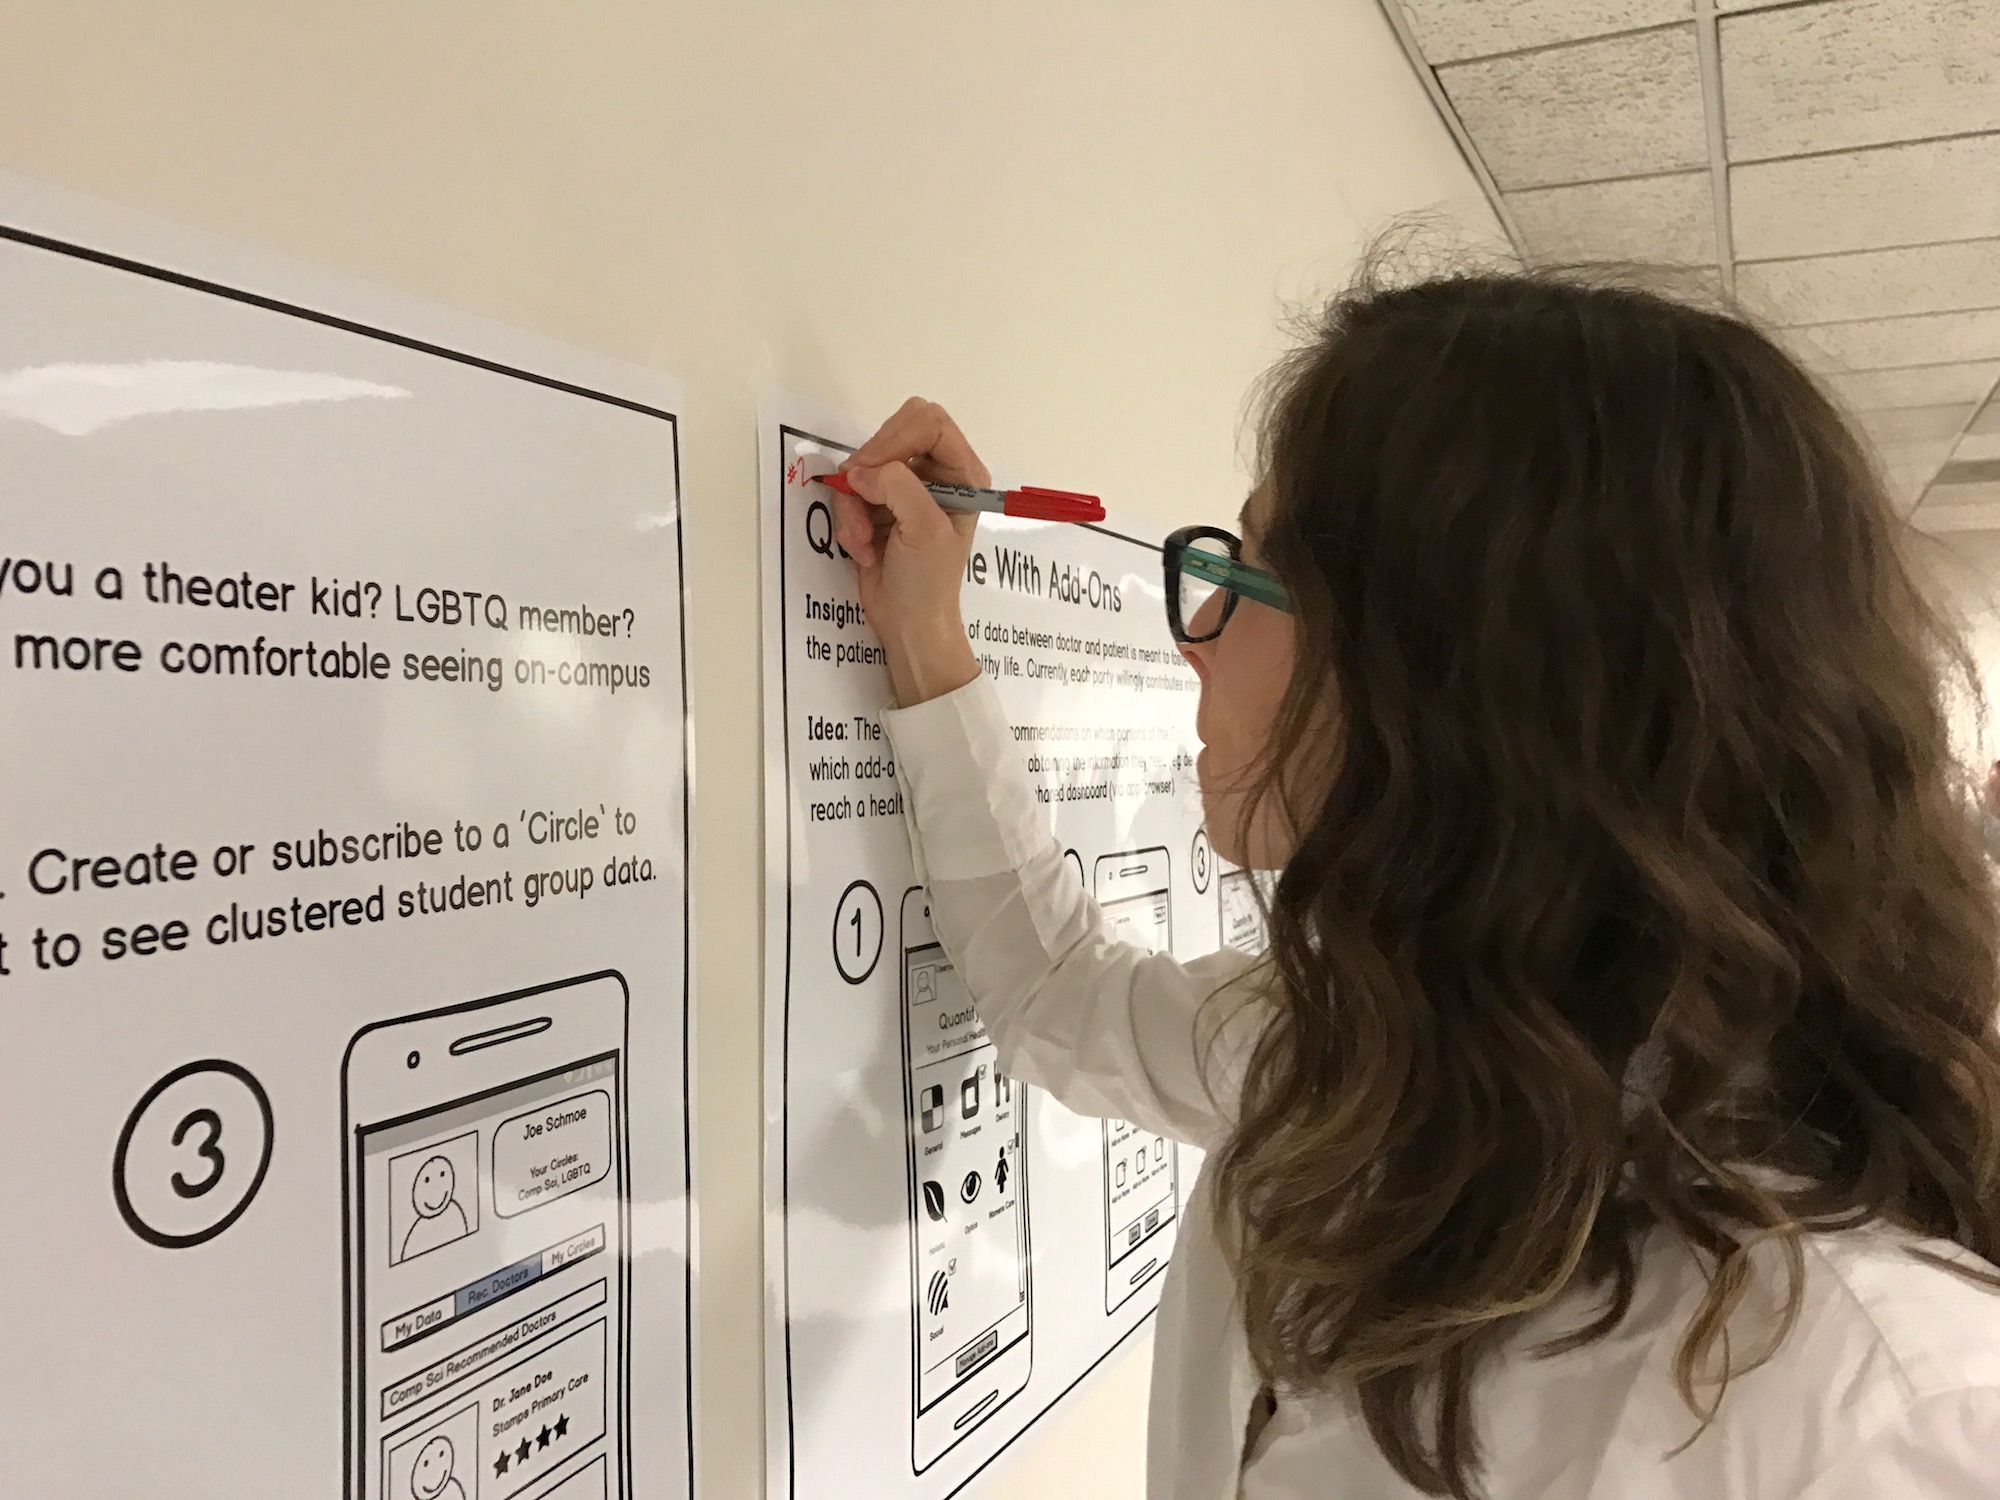
Design Sprint
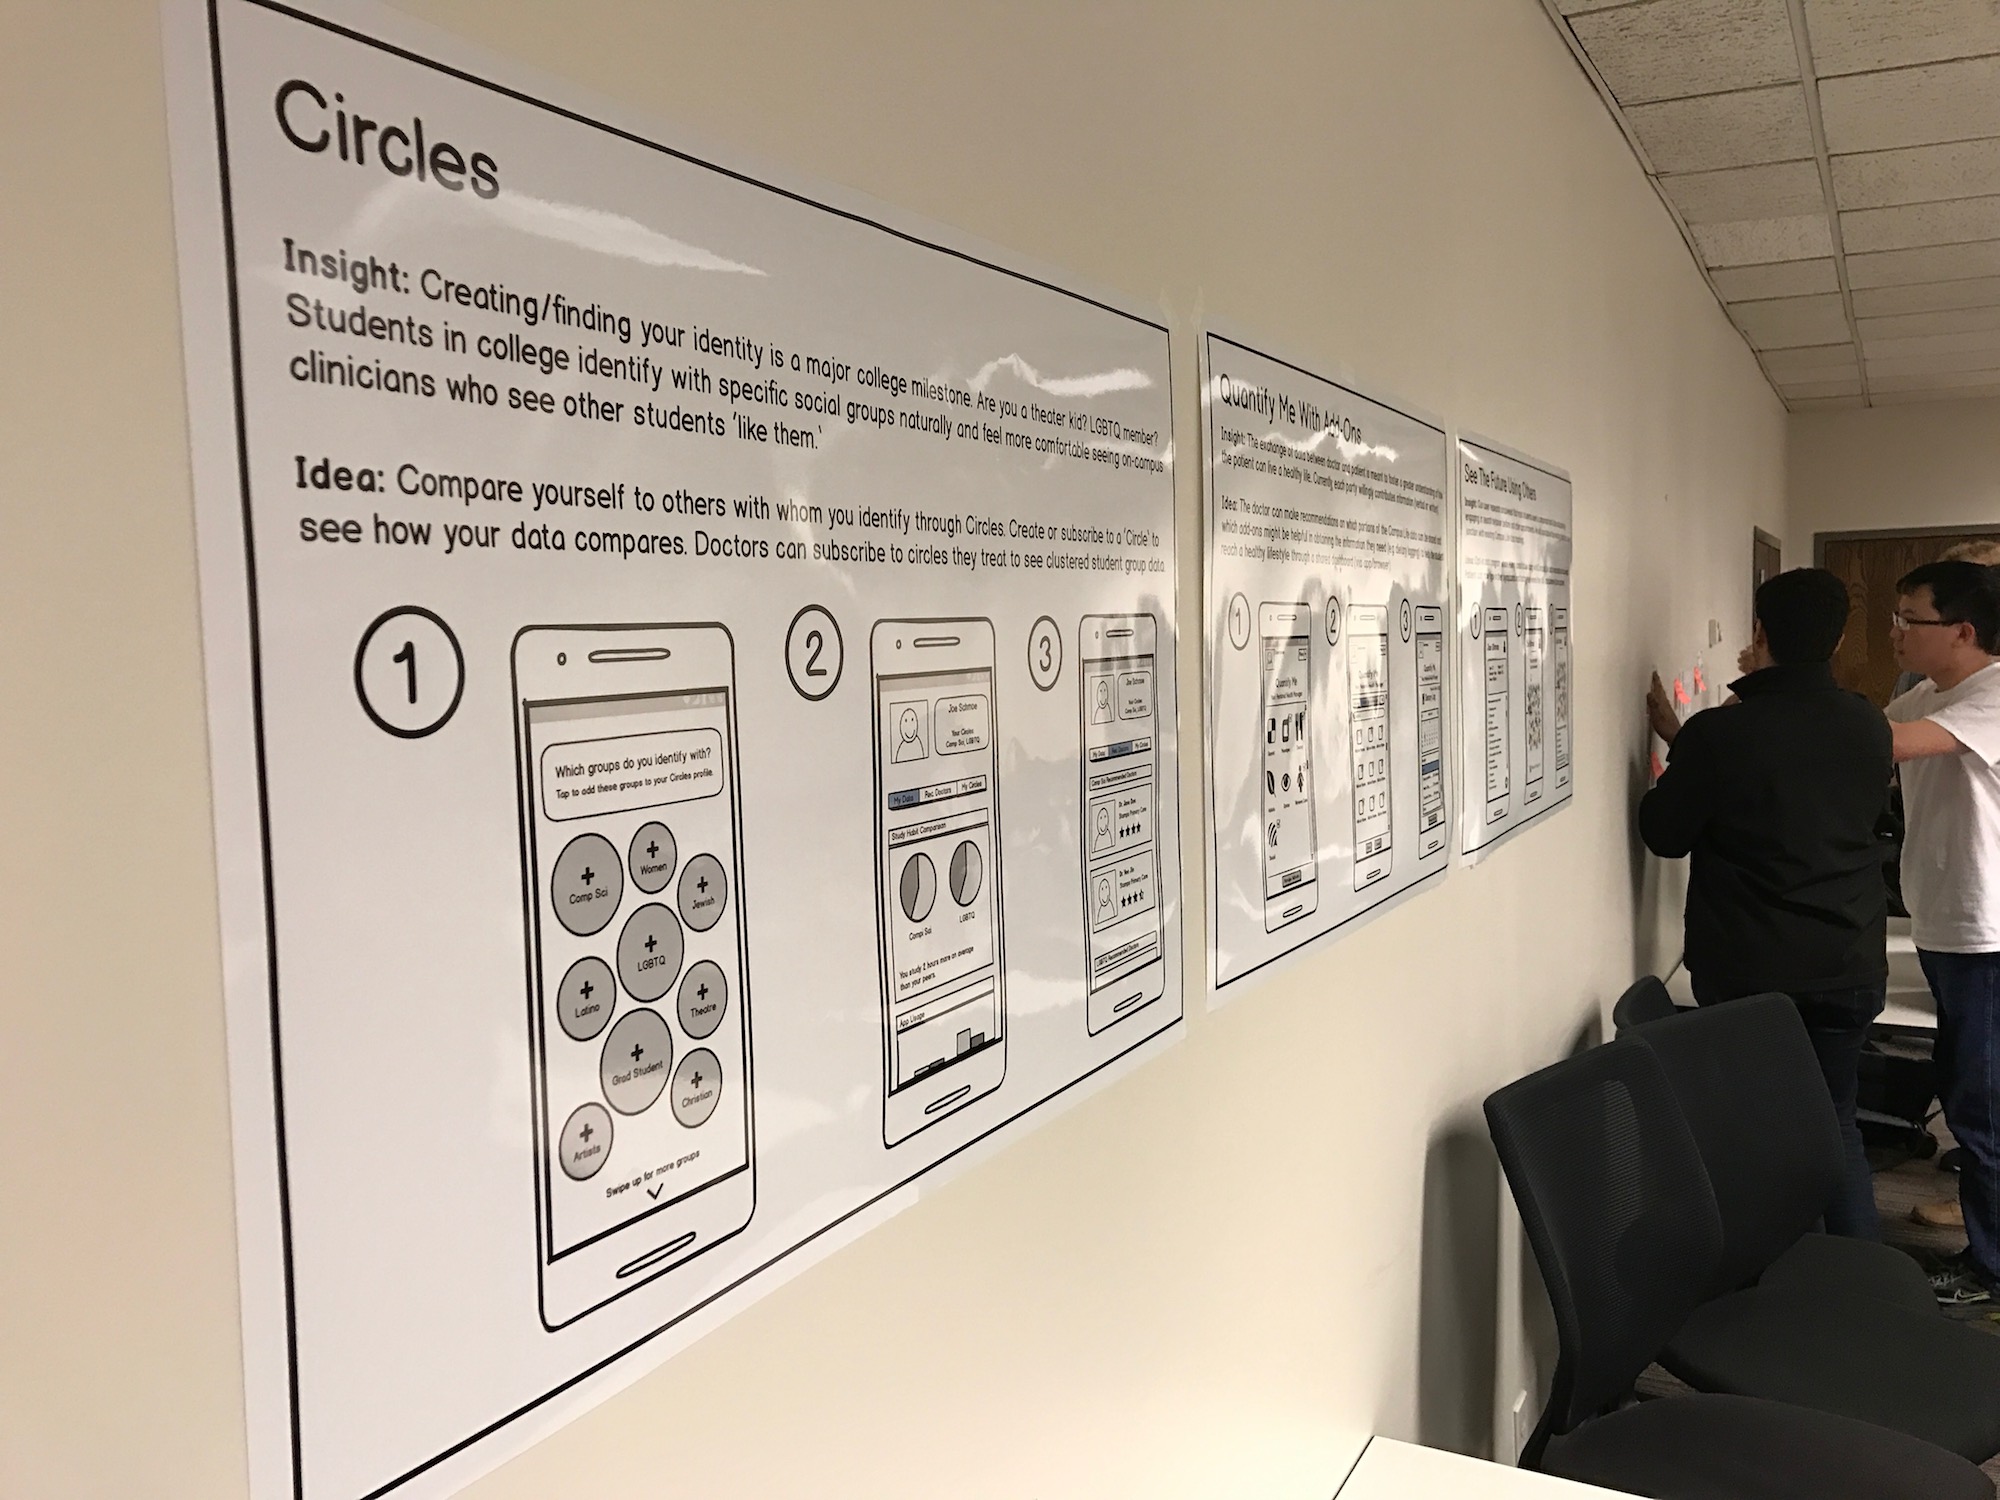
With these three ideas, we storyboarded each for a poster presentation. The ideas ranged from a completely human-centered health identification system to a data-driven system that visualizes social context. Classmates anonymously voted for each idea using colored stickers.
Green is good. Yellow is neutral. Red is bad. Blue is confusing.

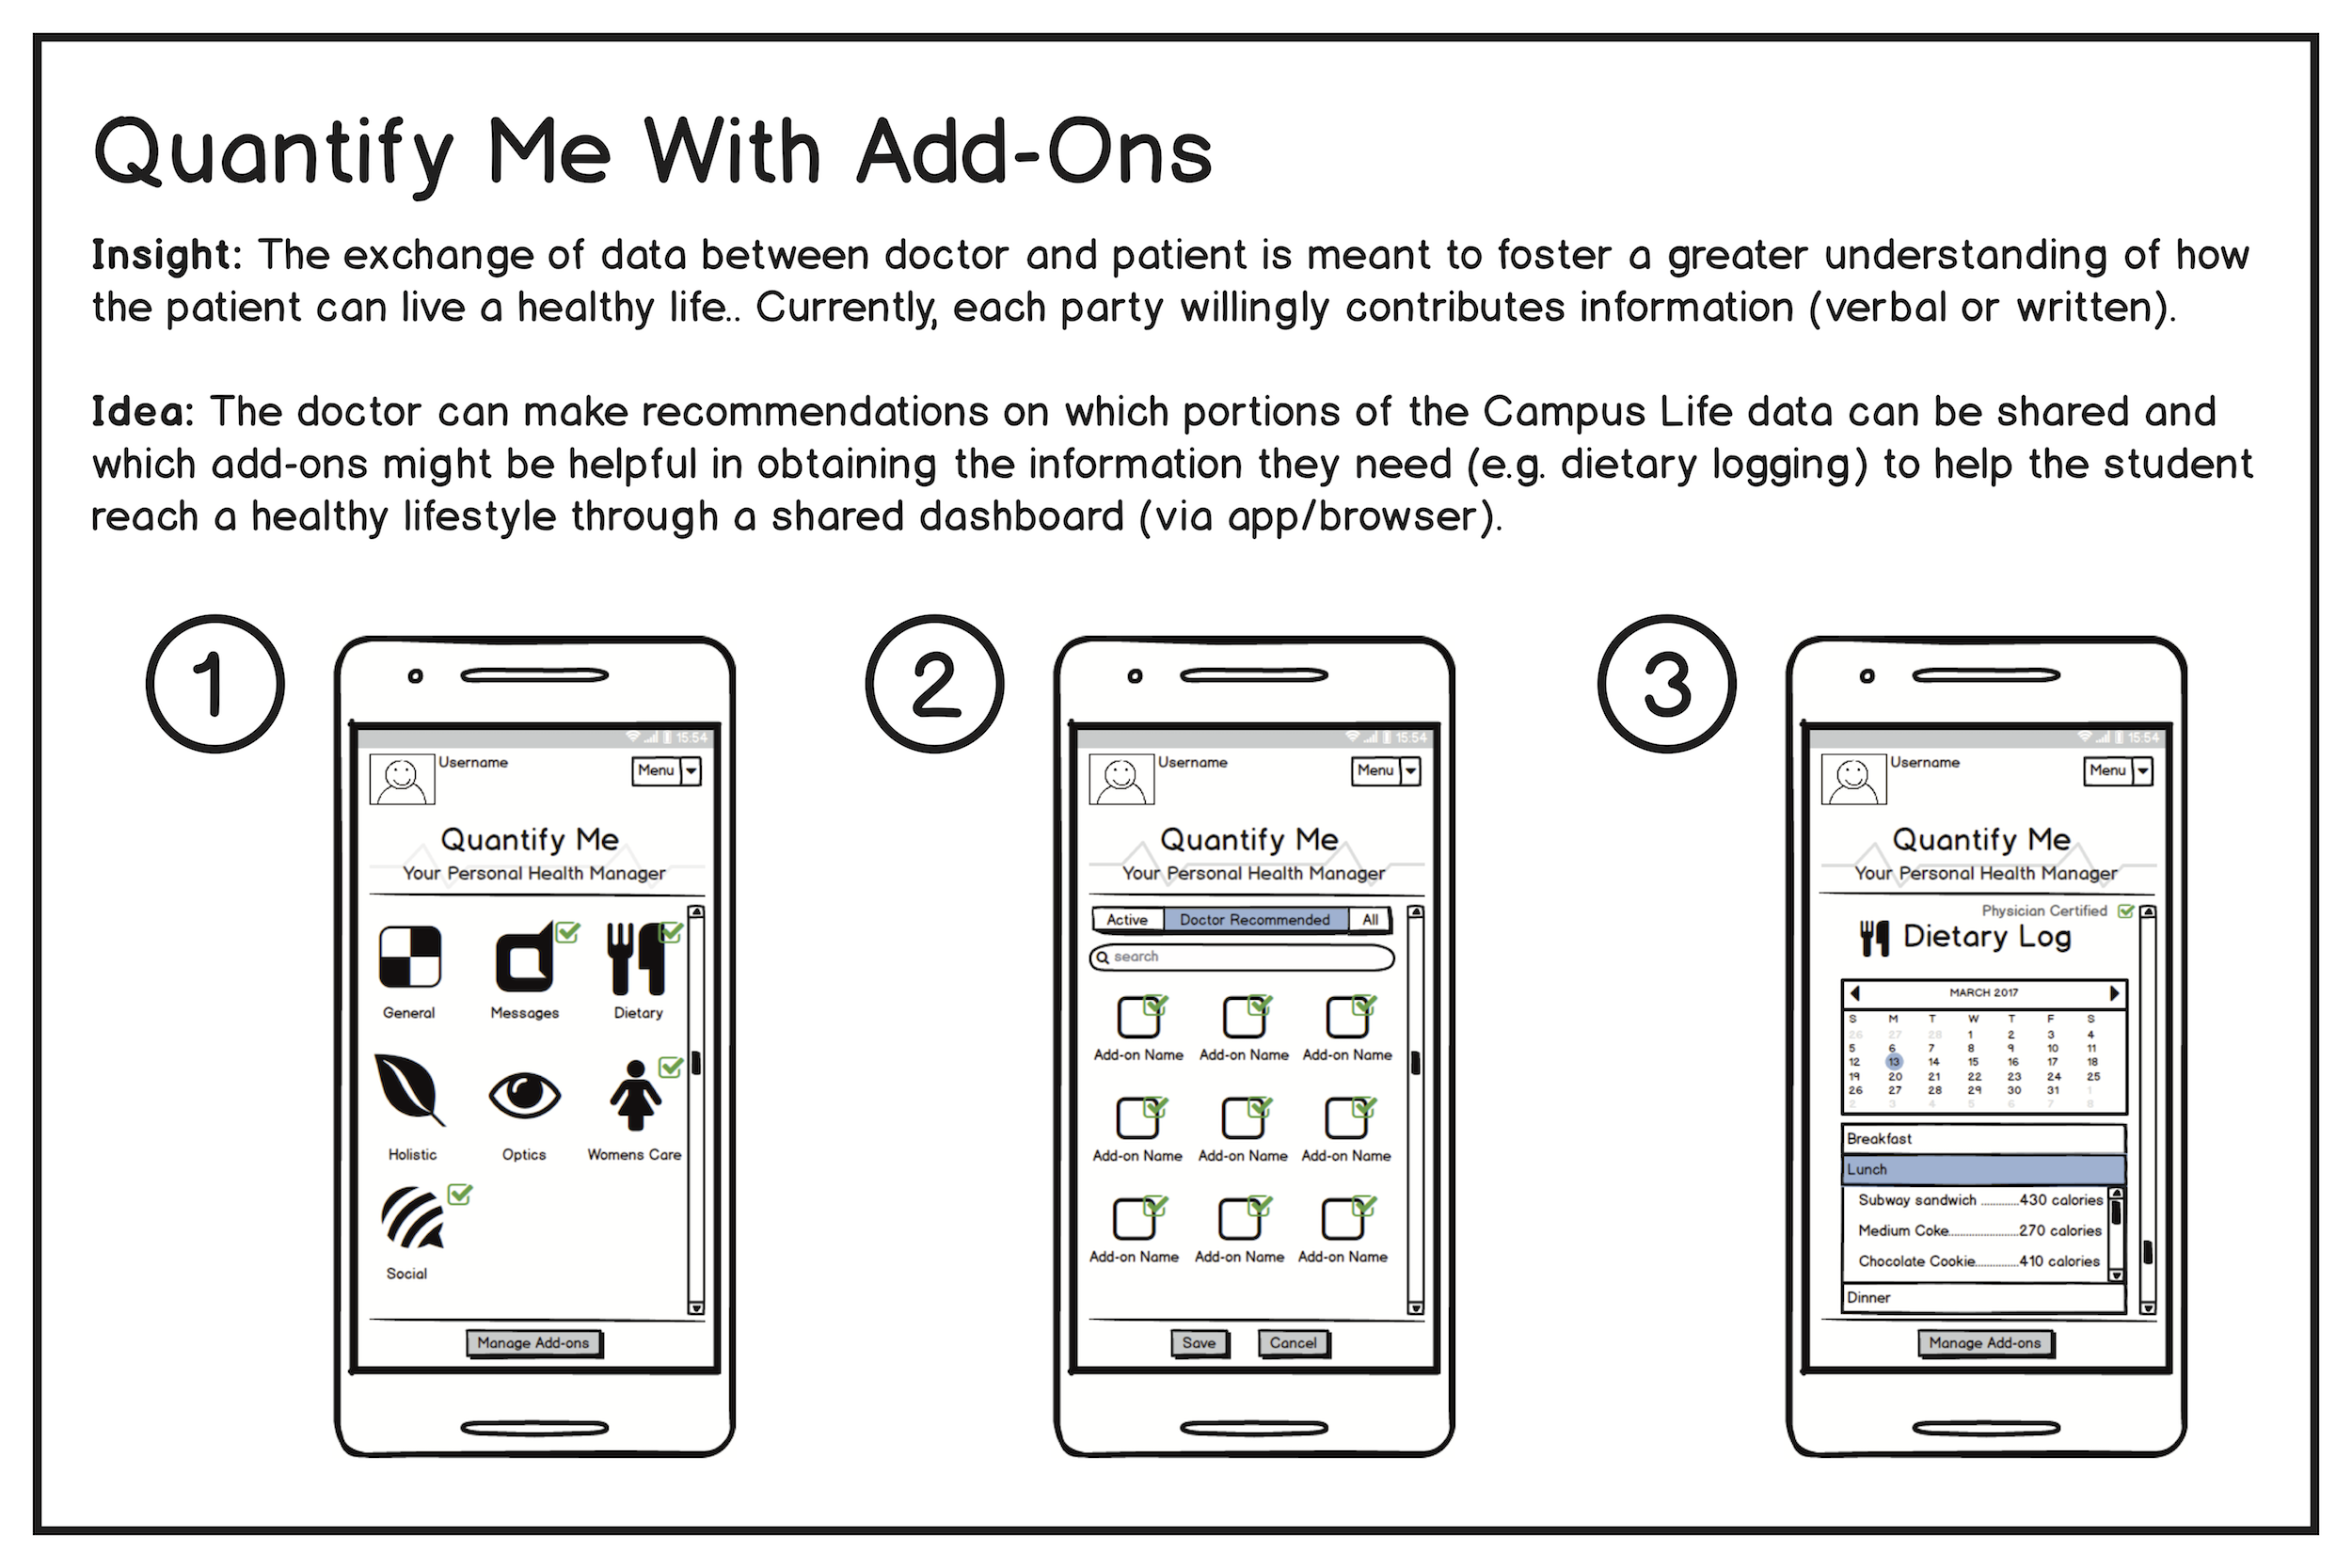

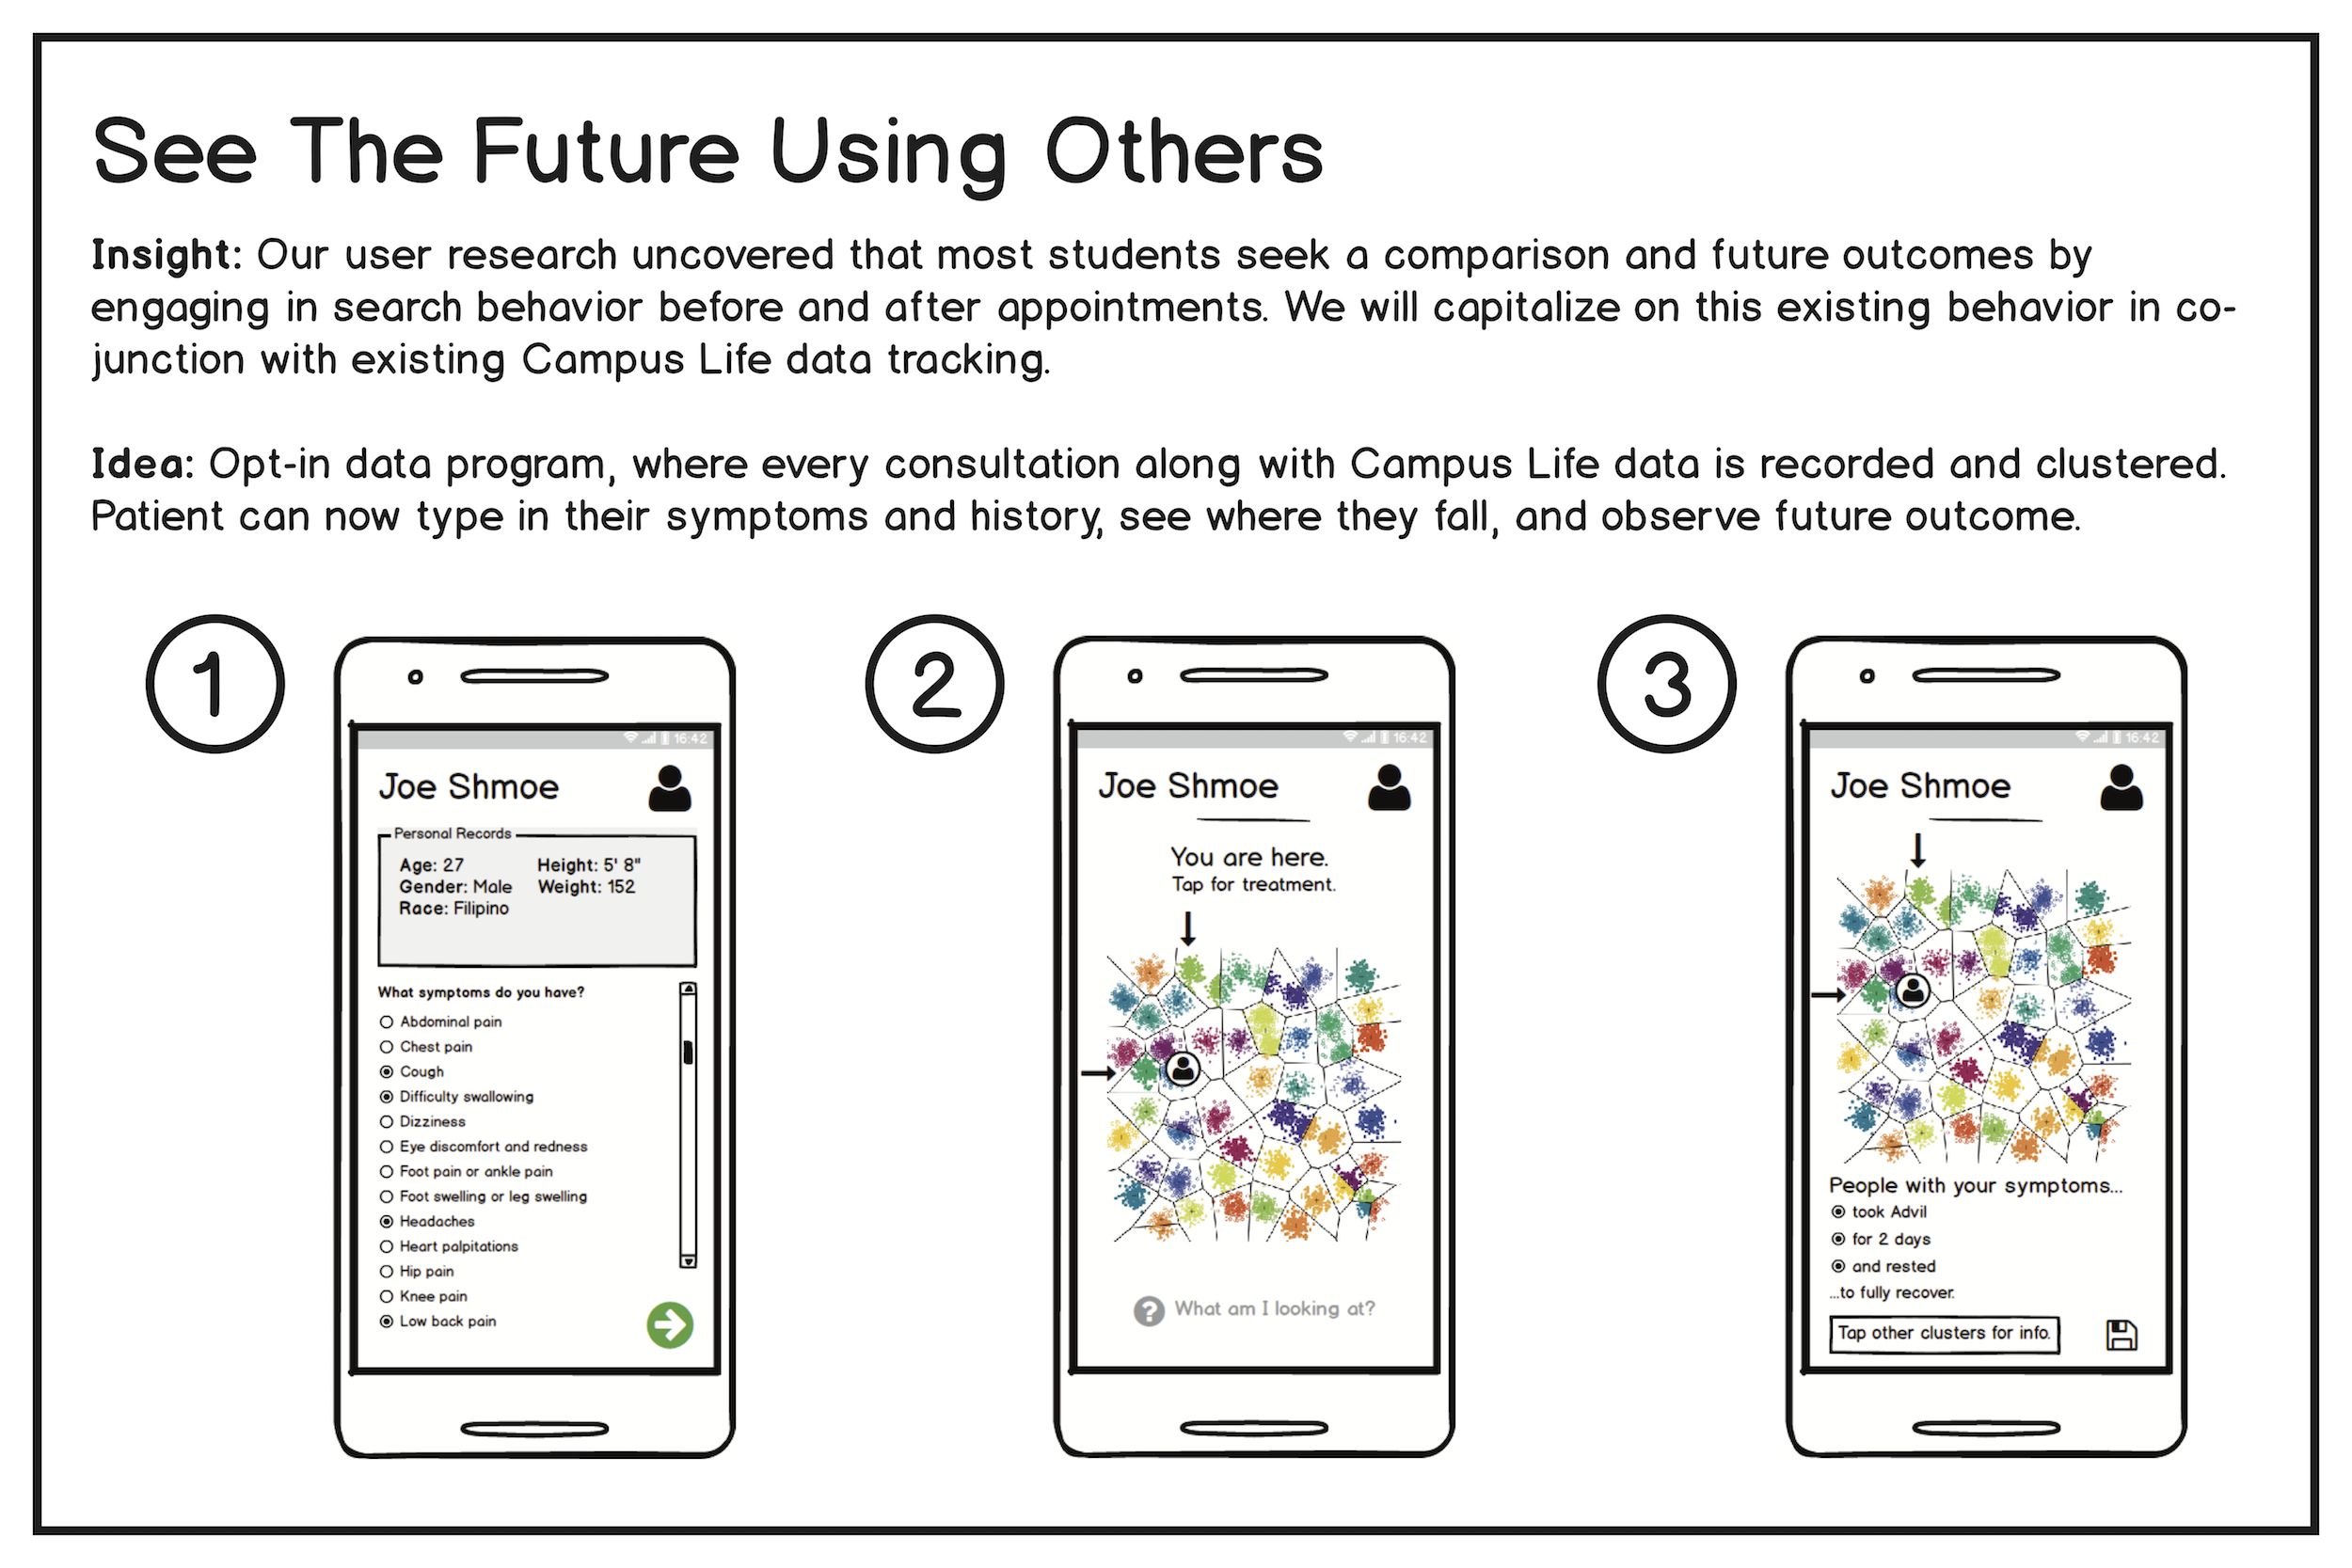

Our fellow classmates and professor gave insightful feedback, and it became clear which ideas were starting to stick. More importantly, our team recognized the importance of the time a student spends in a consultation.
Revisiting Ideation One More Time
With our new feedback in mind, we looked at our initial matrix of ideas one more time to see if we could combine multiple ideas into our final prototype that could incorporate novel interactions which serve to better facilitate data sharing during primary care appointments.
We began to envision a device present in consultation rooms where a patient could display their personal tracking data and review it with their doctor. We identified two design characteristics:
- The current appointment space layout is centered around the patient chair.
- Depending the communication style of the doctor and his or her relationship with the patient (and particular needs of the appointment), they may prefer to demonstrate information or host an interactive conversation.
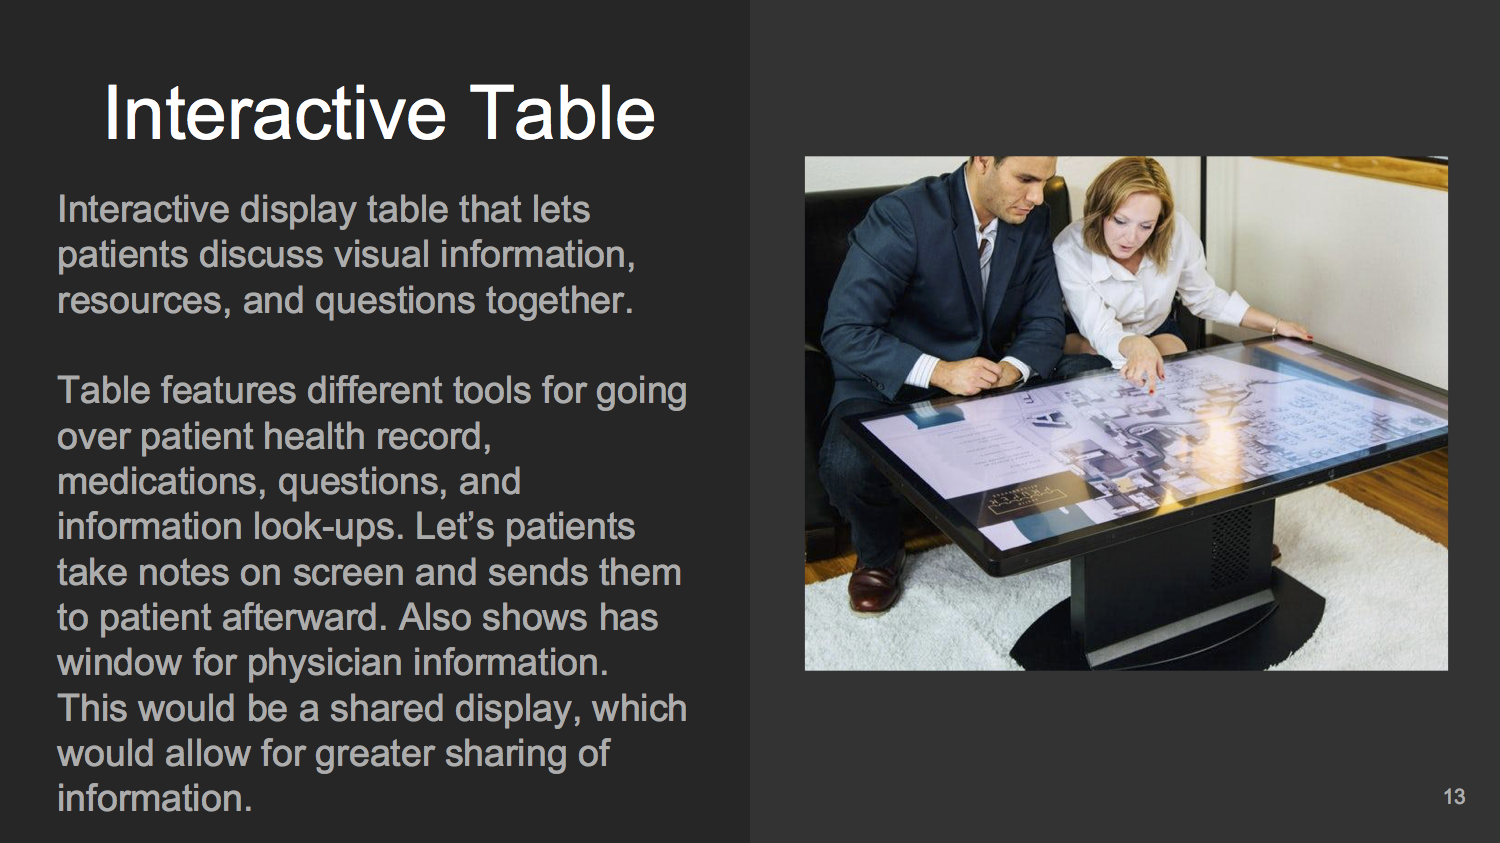
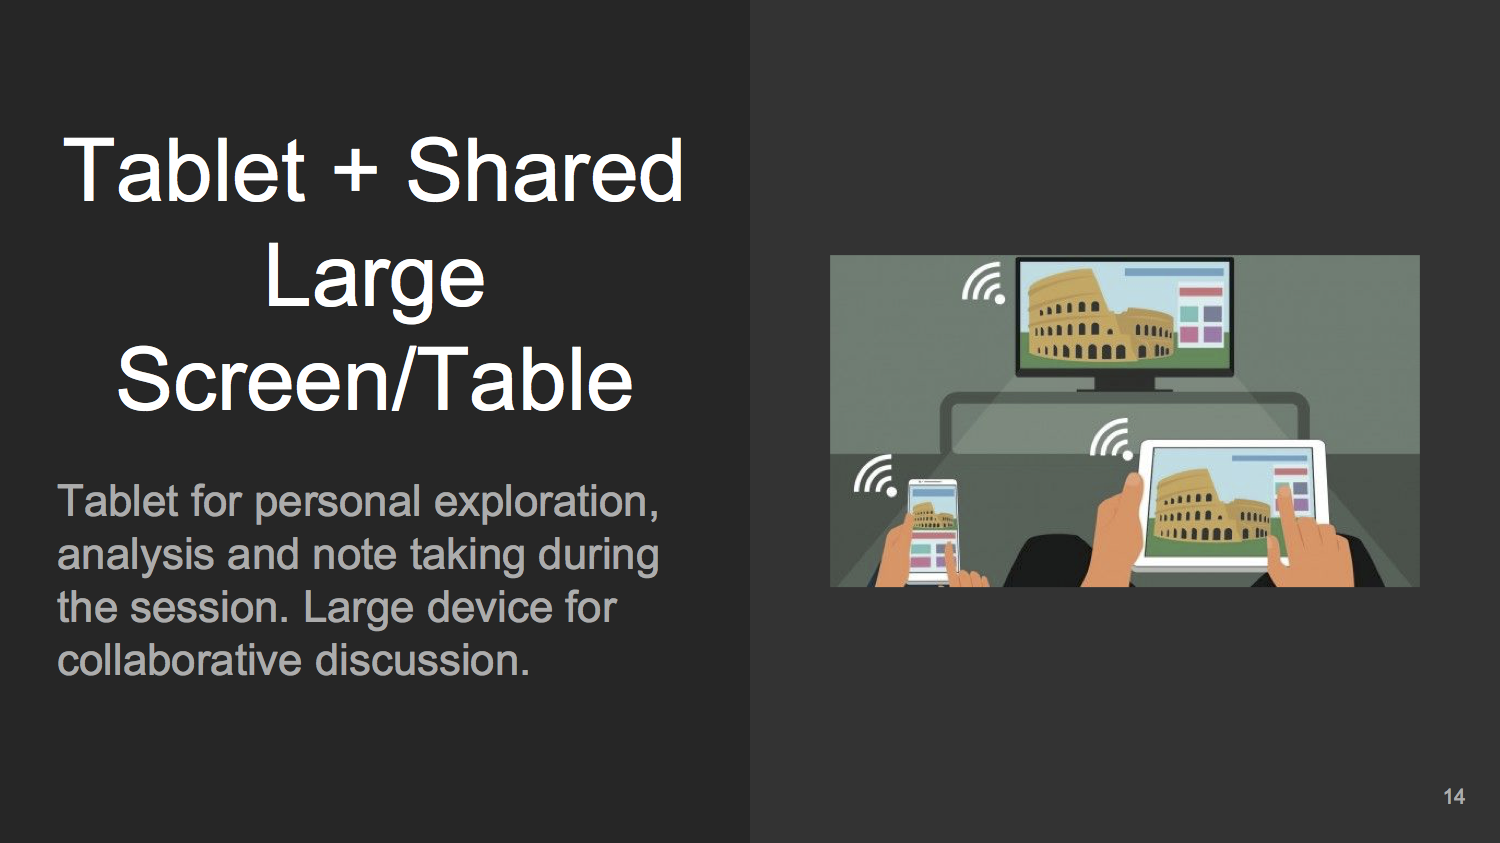
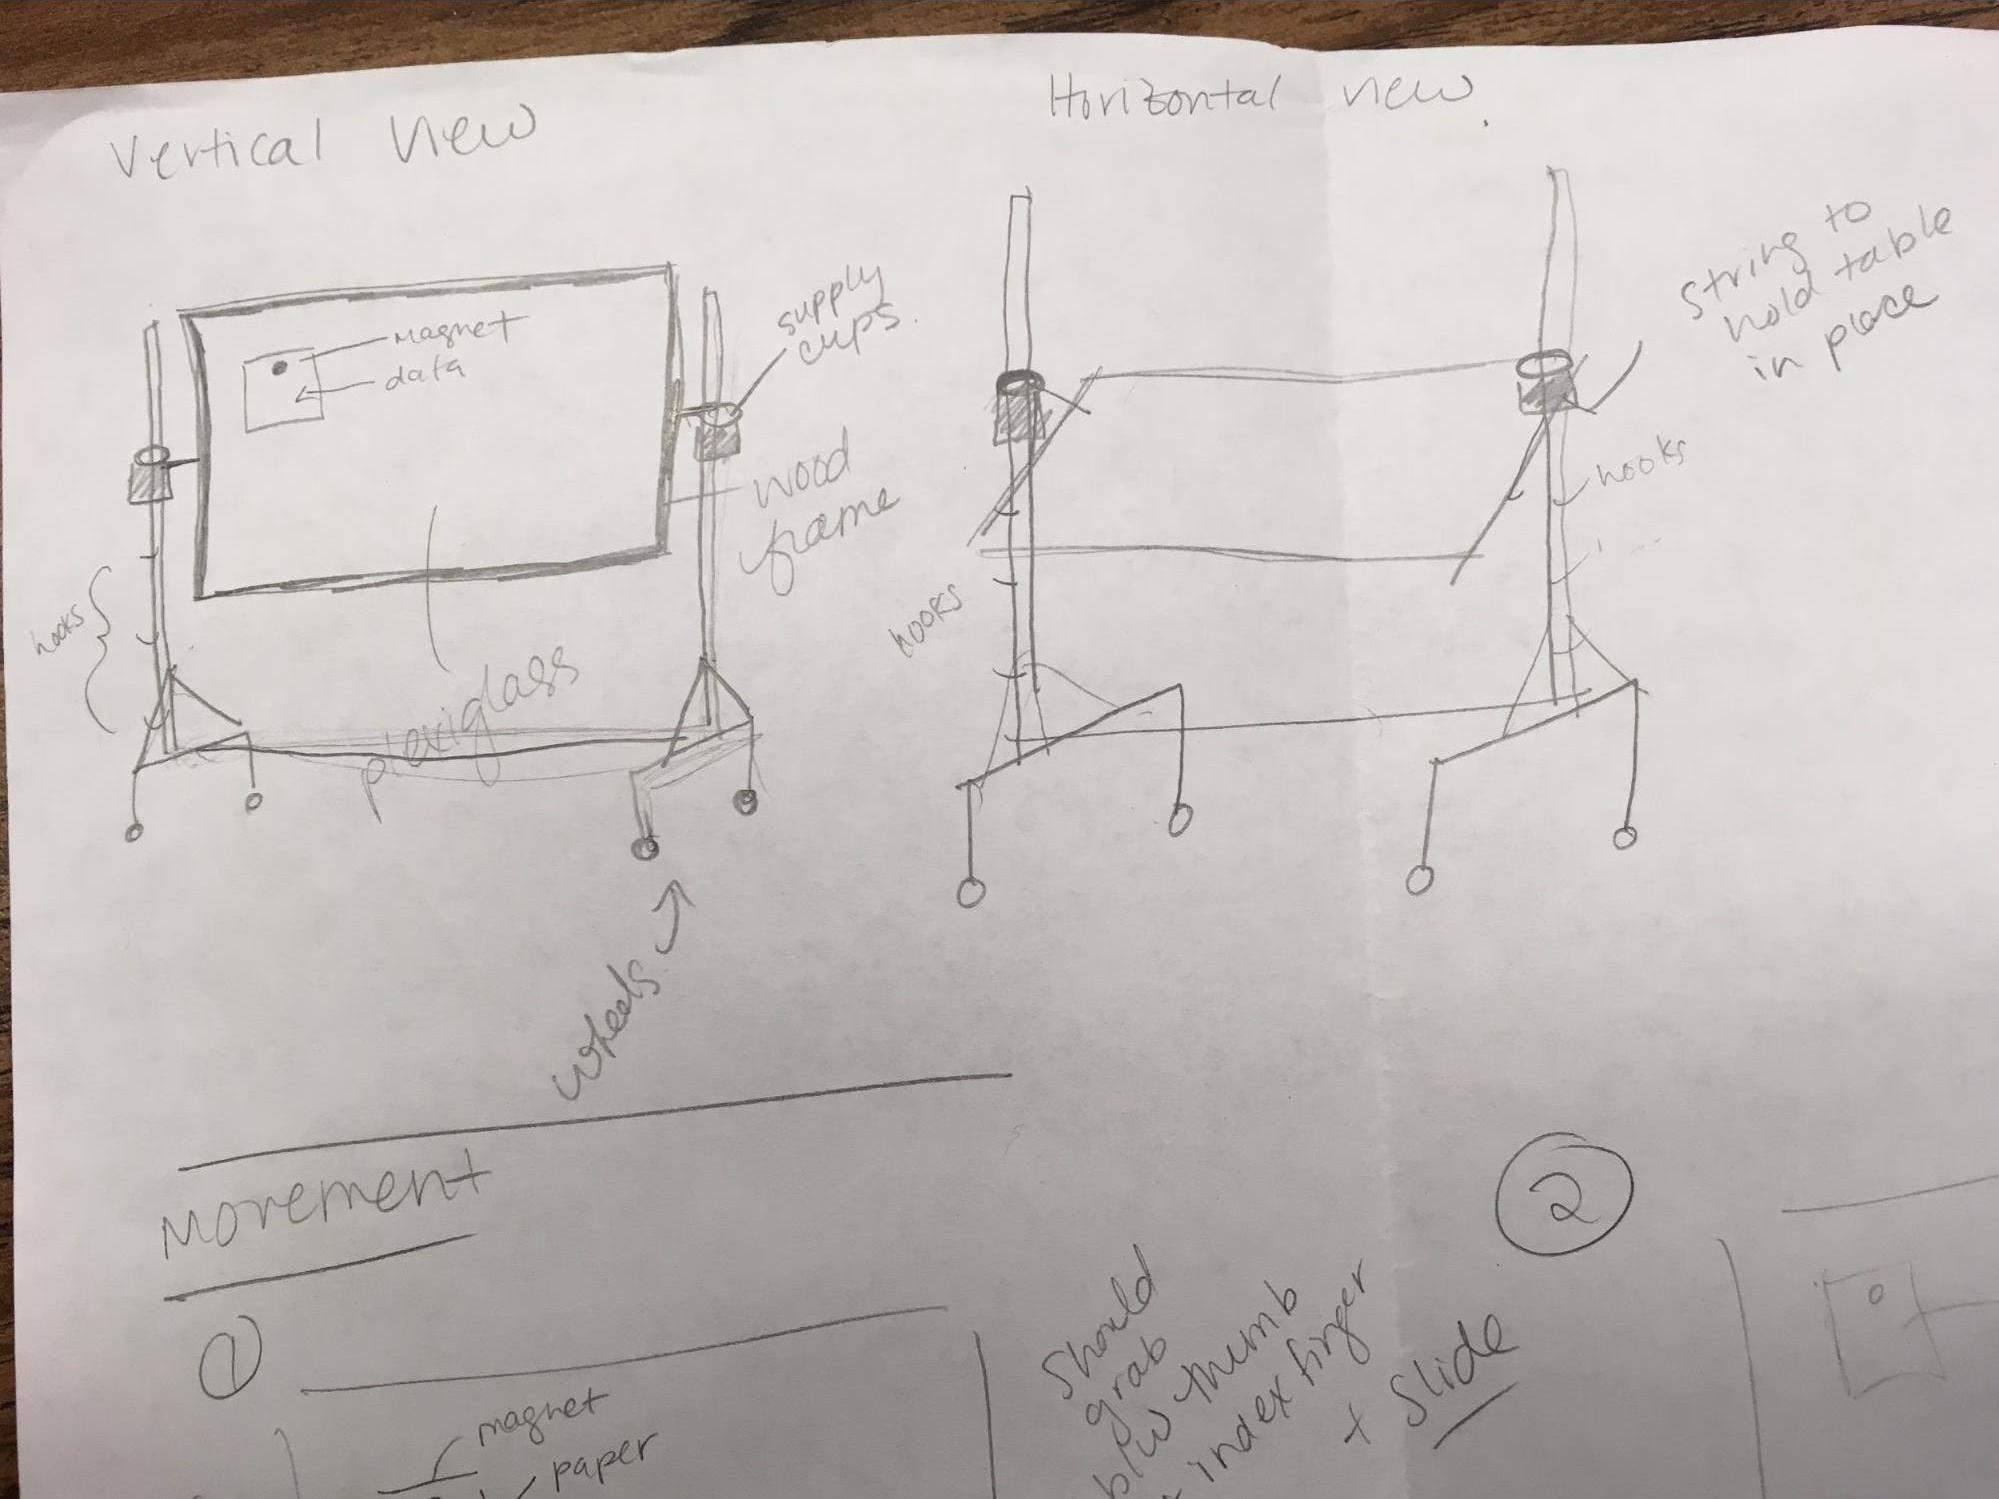
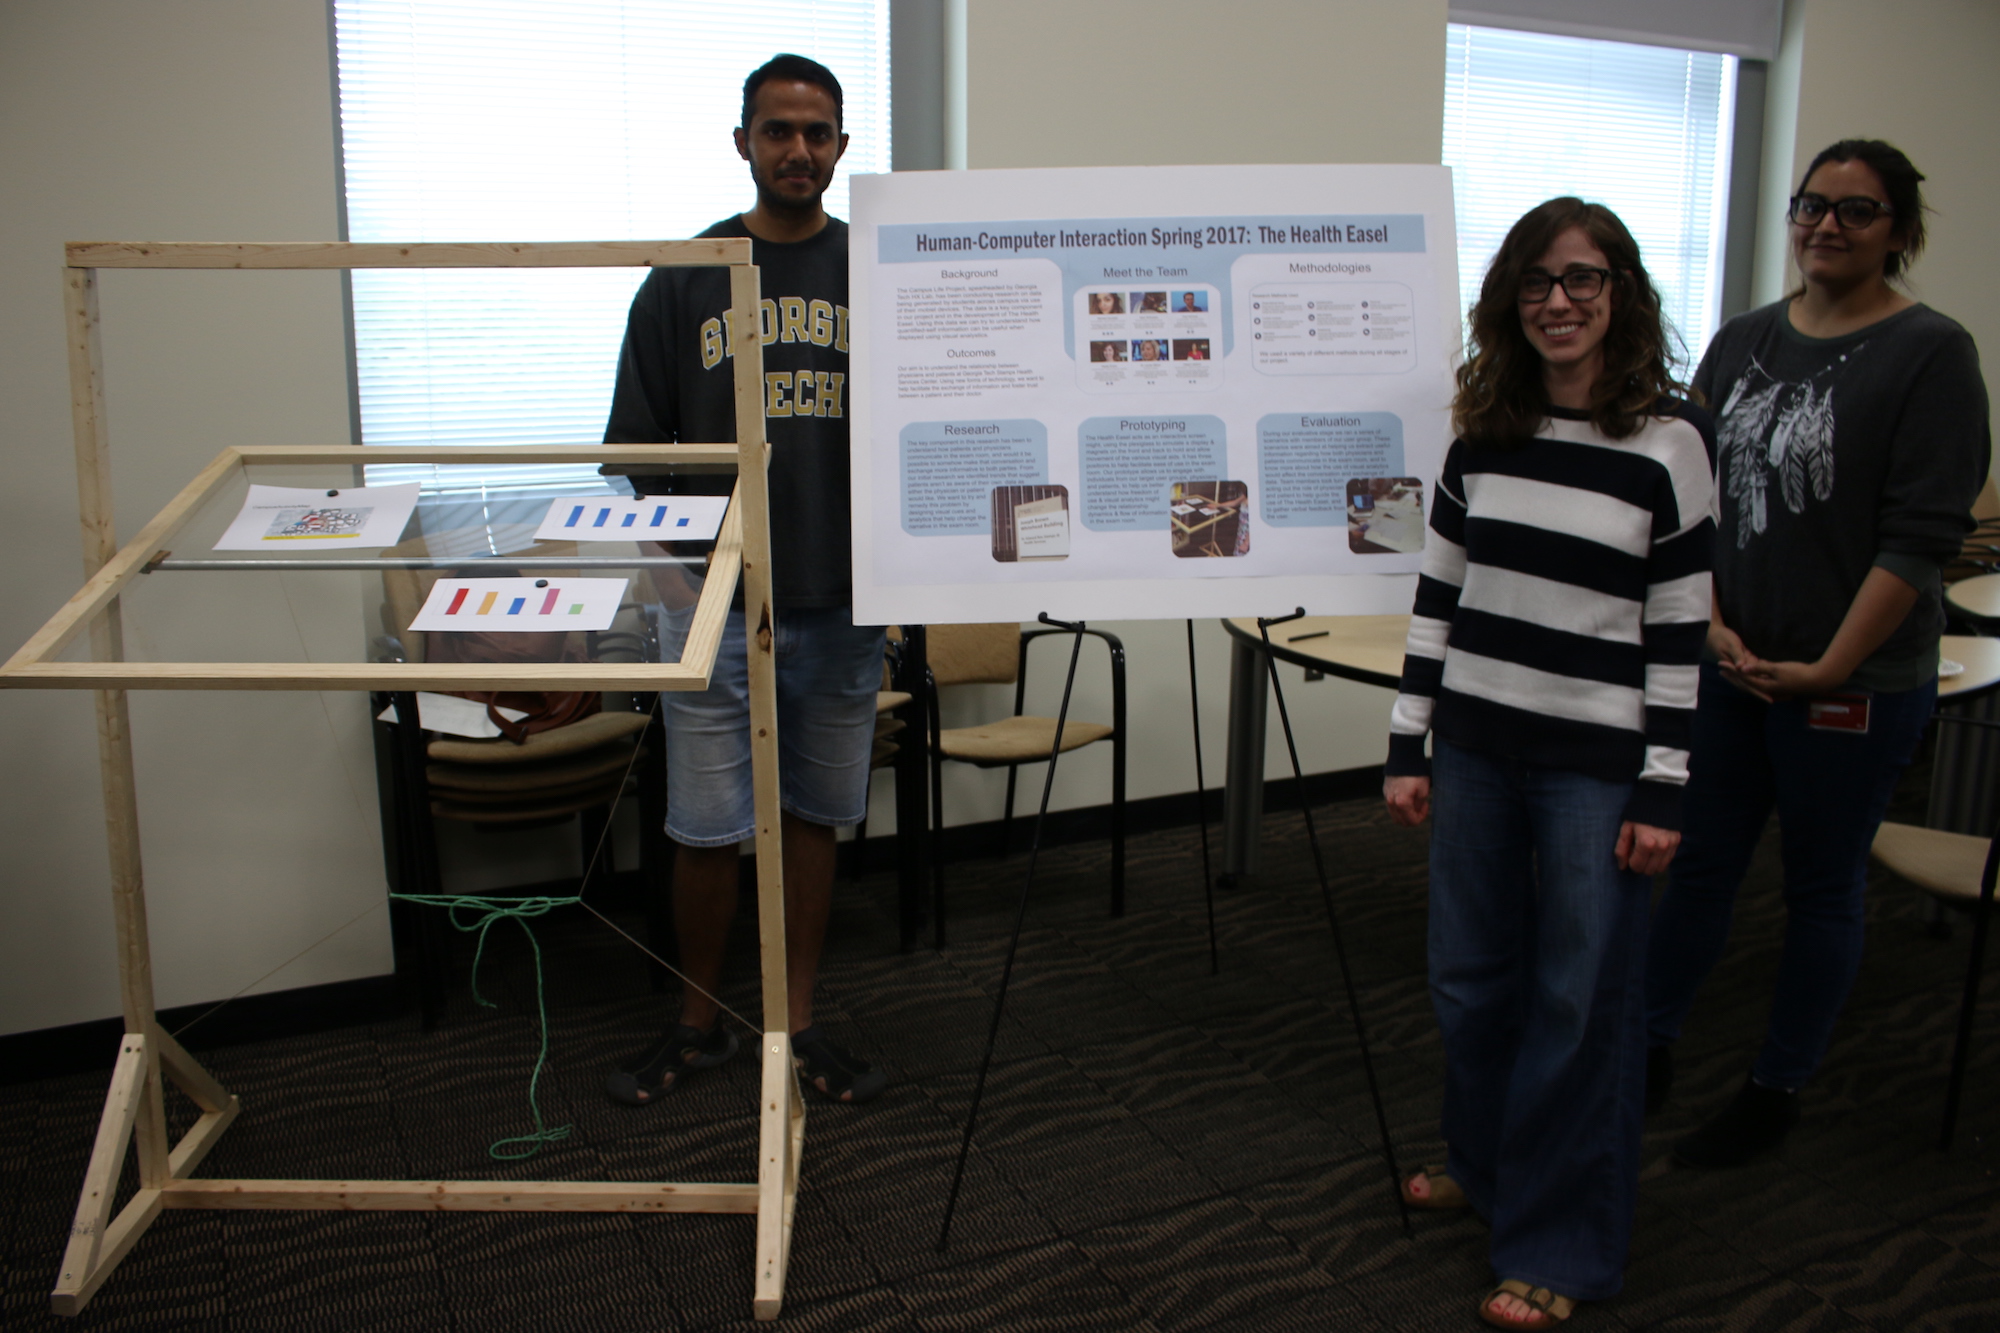
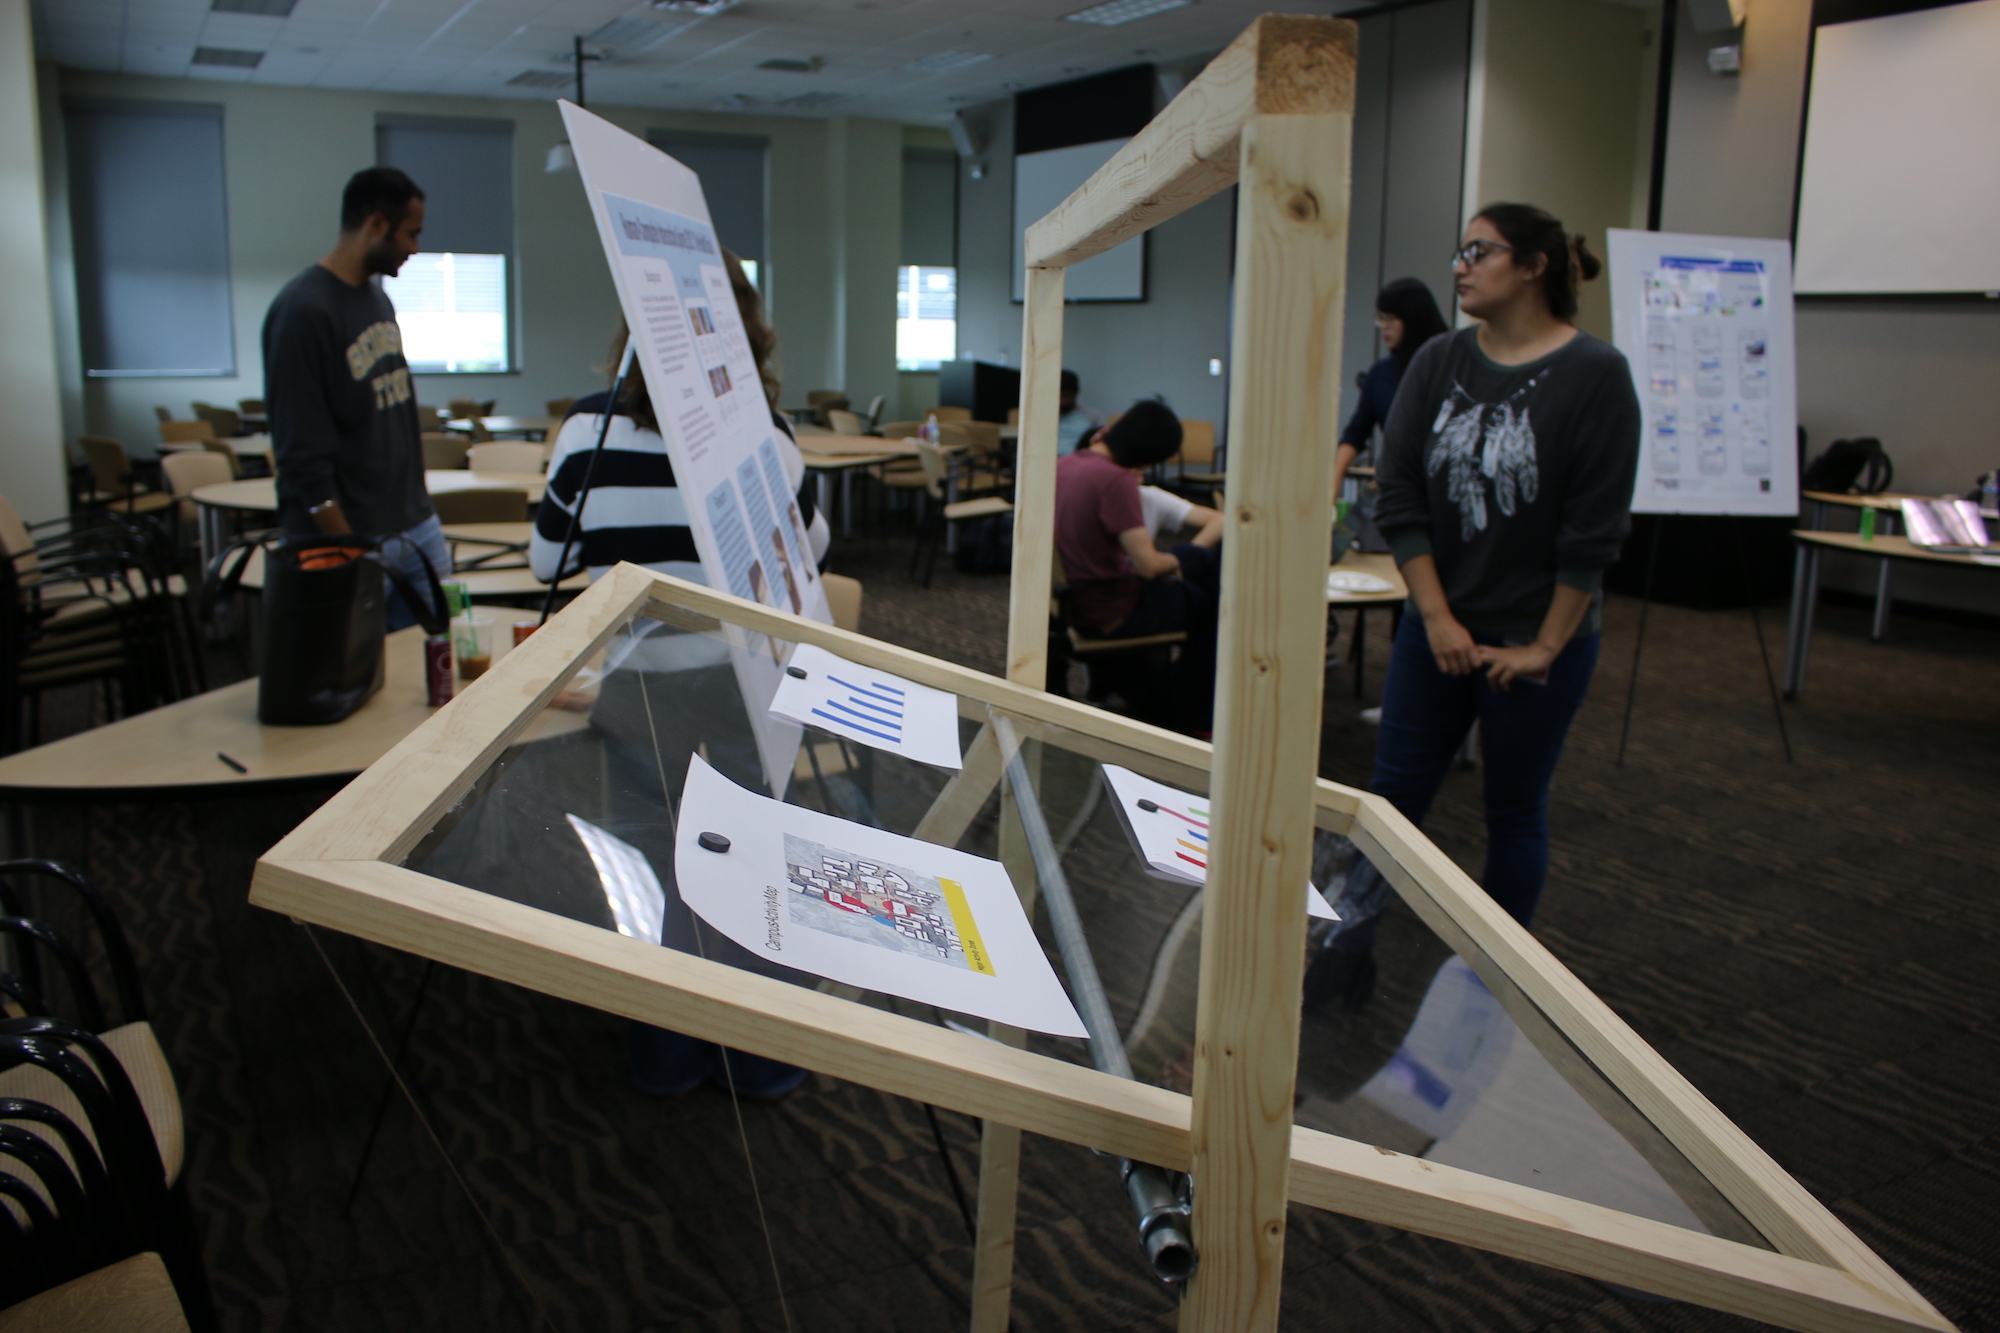
Developing a Physical Prototype
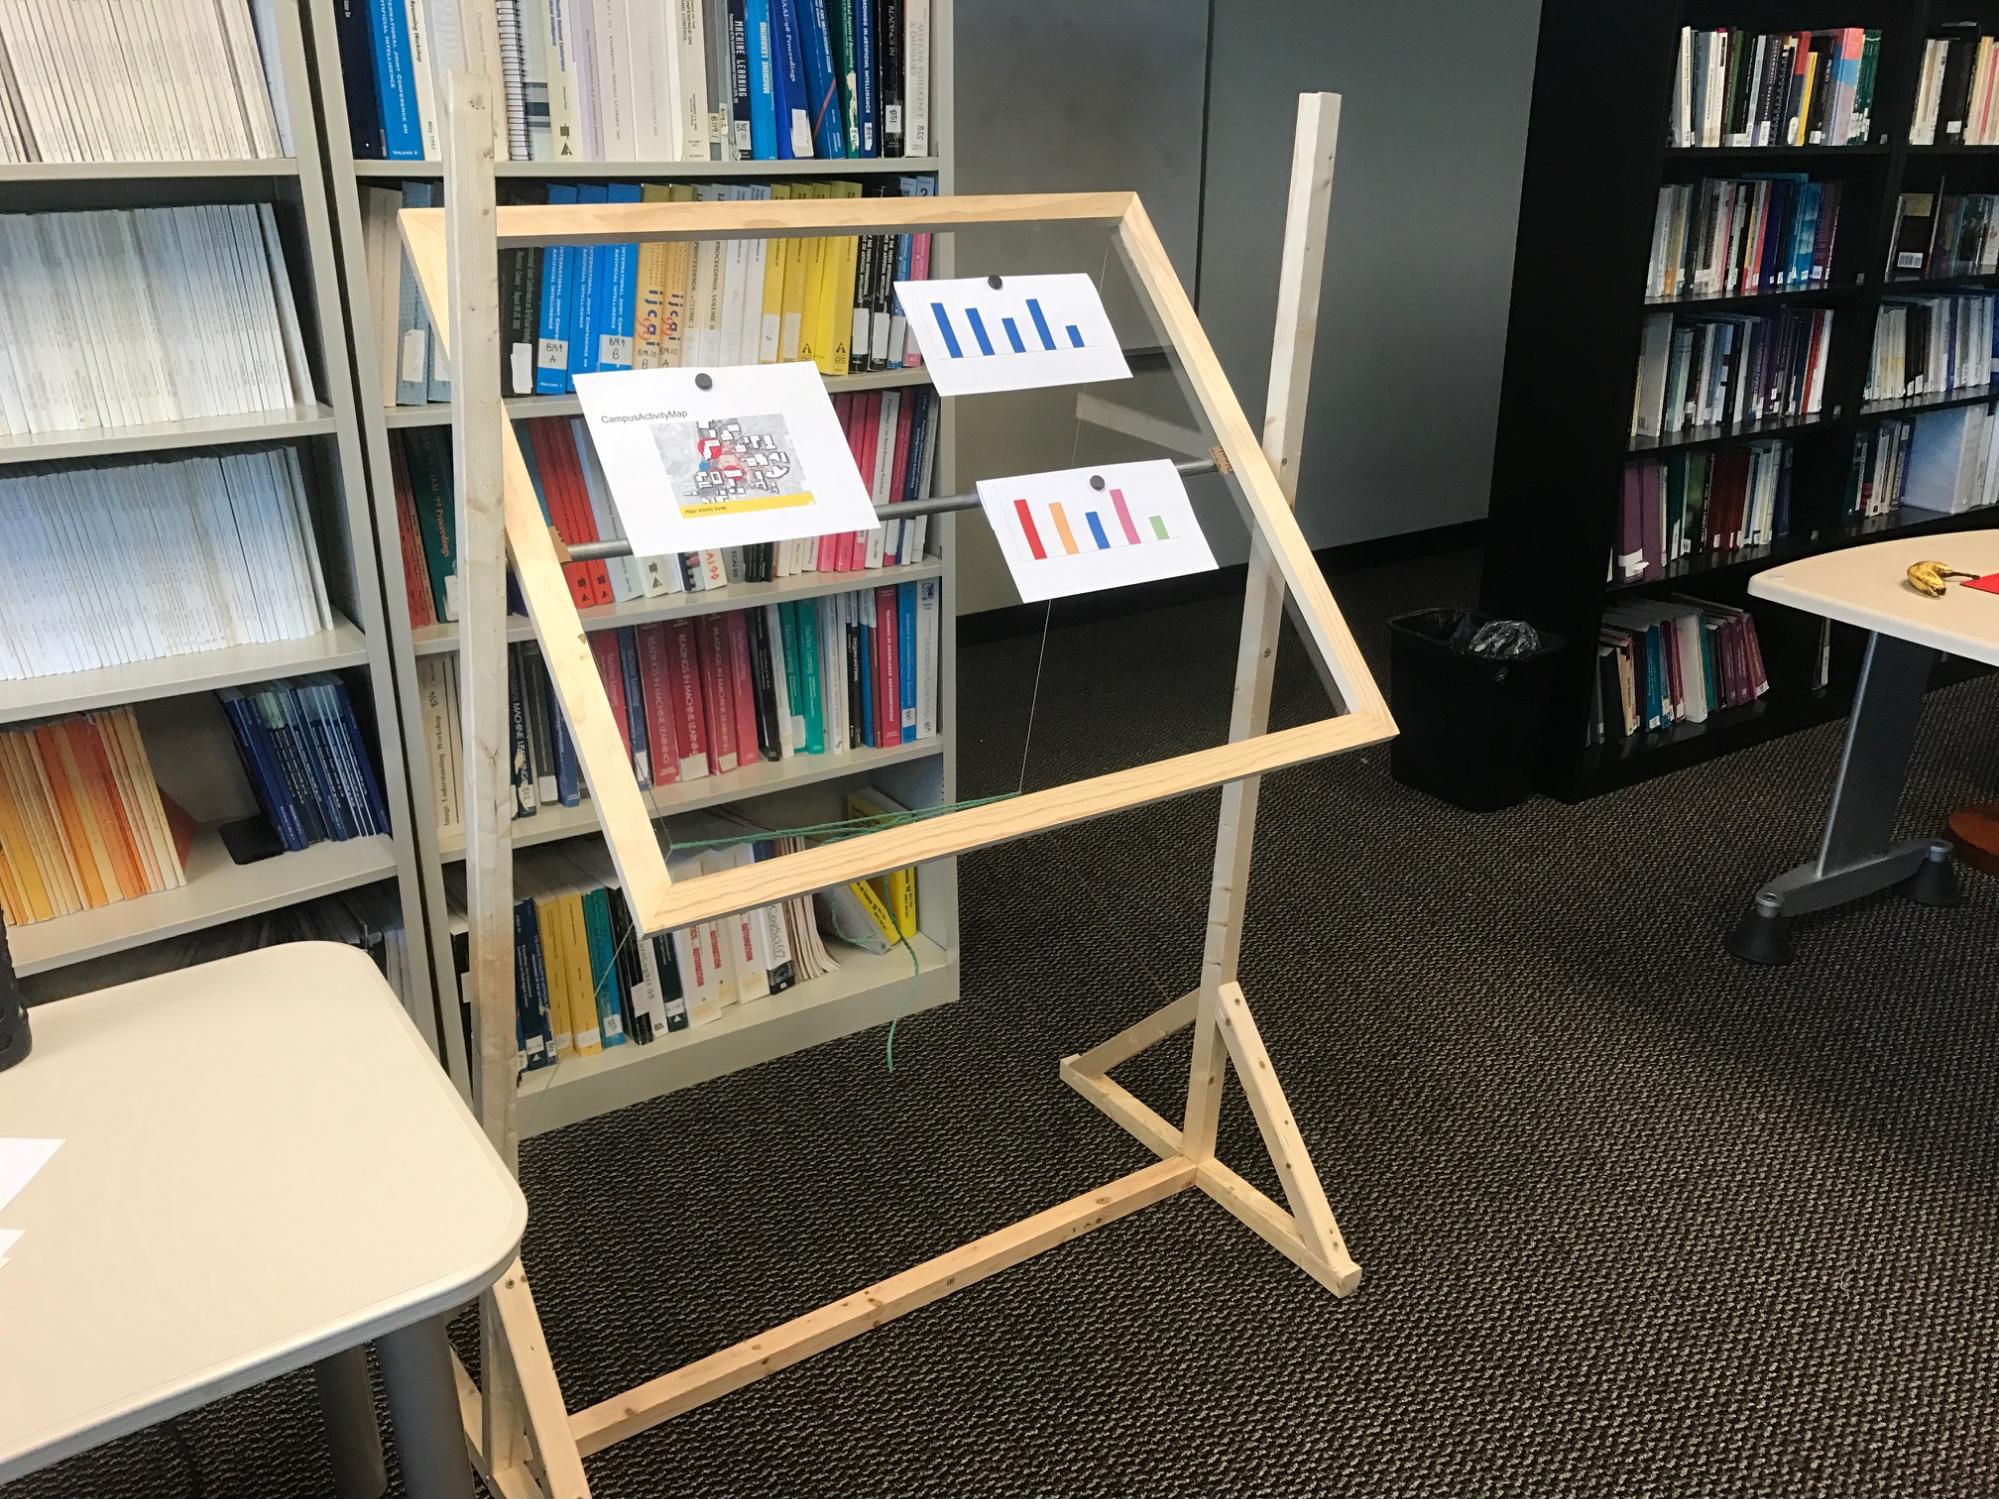
We sketched out a device that features a large, high-resolution touch screen display mounted on a swiveling easel. This enables three different usage positions:
- Standing position: straight back, great for presentation and explanation from one user to the other.
- Inclined position: at a height that allows users to sit in the examination chair and comfortably interact with the screen as the main user of the display.
- Tabletop position: flattened to simulate a tabletop experience, optimal for visual analytics, collaboration, and discussion.
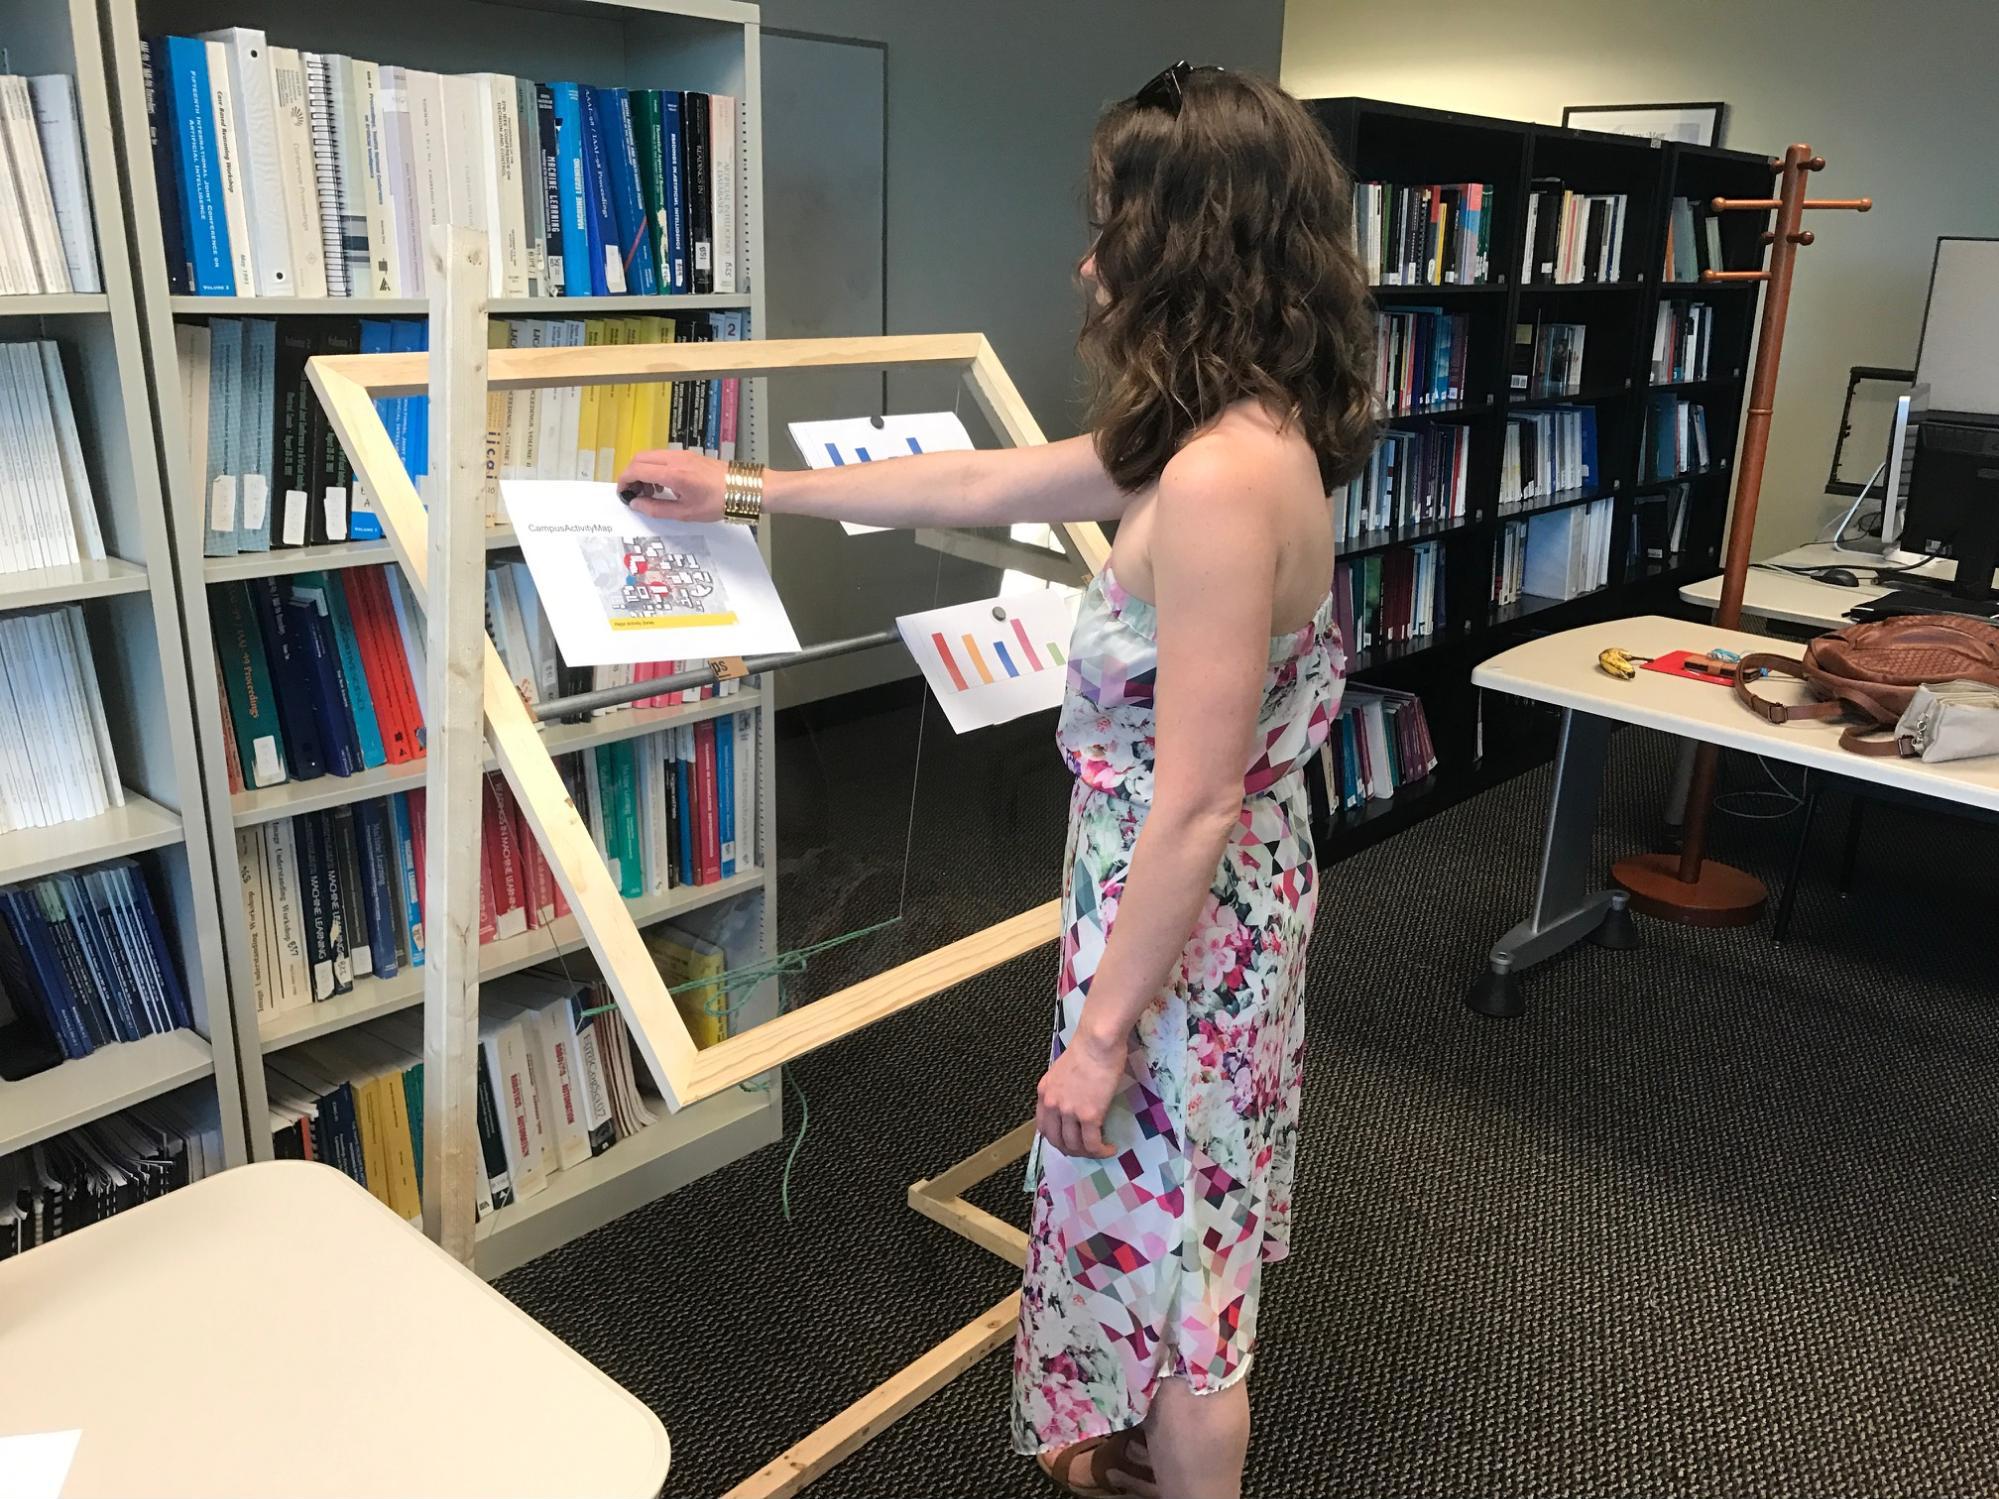
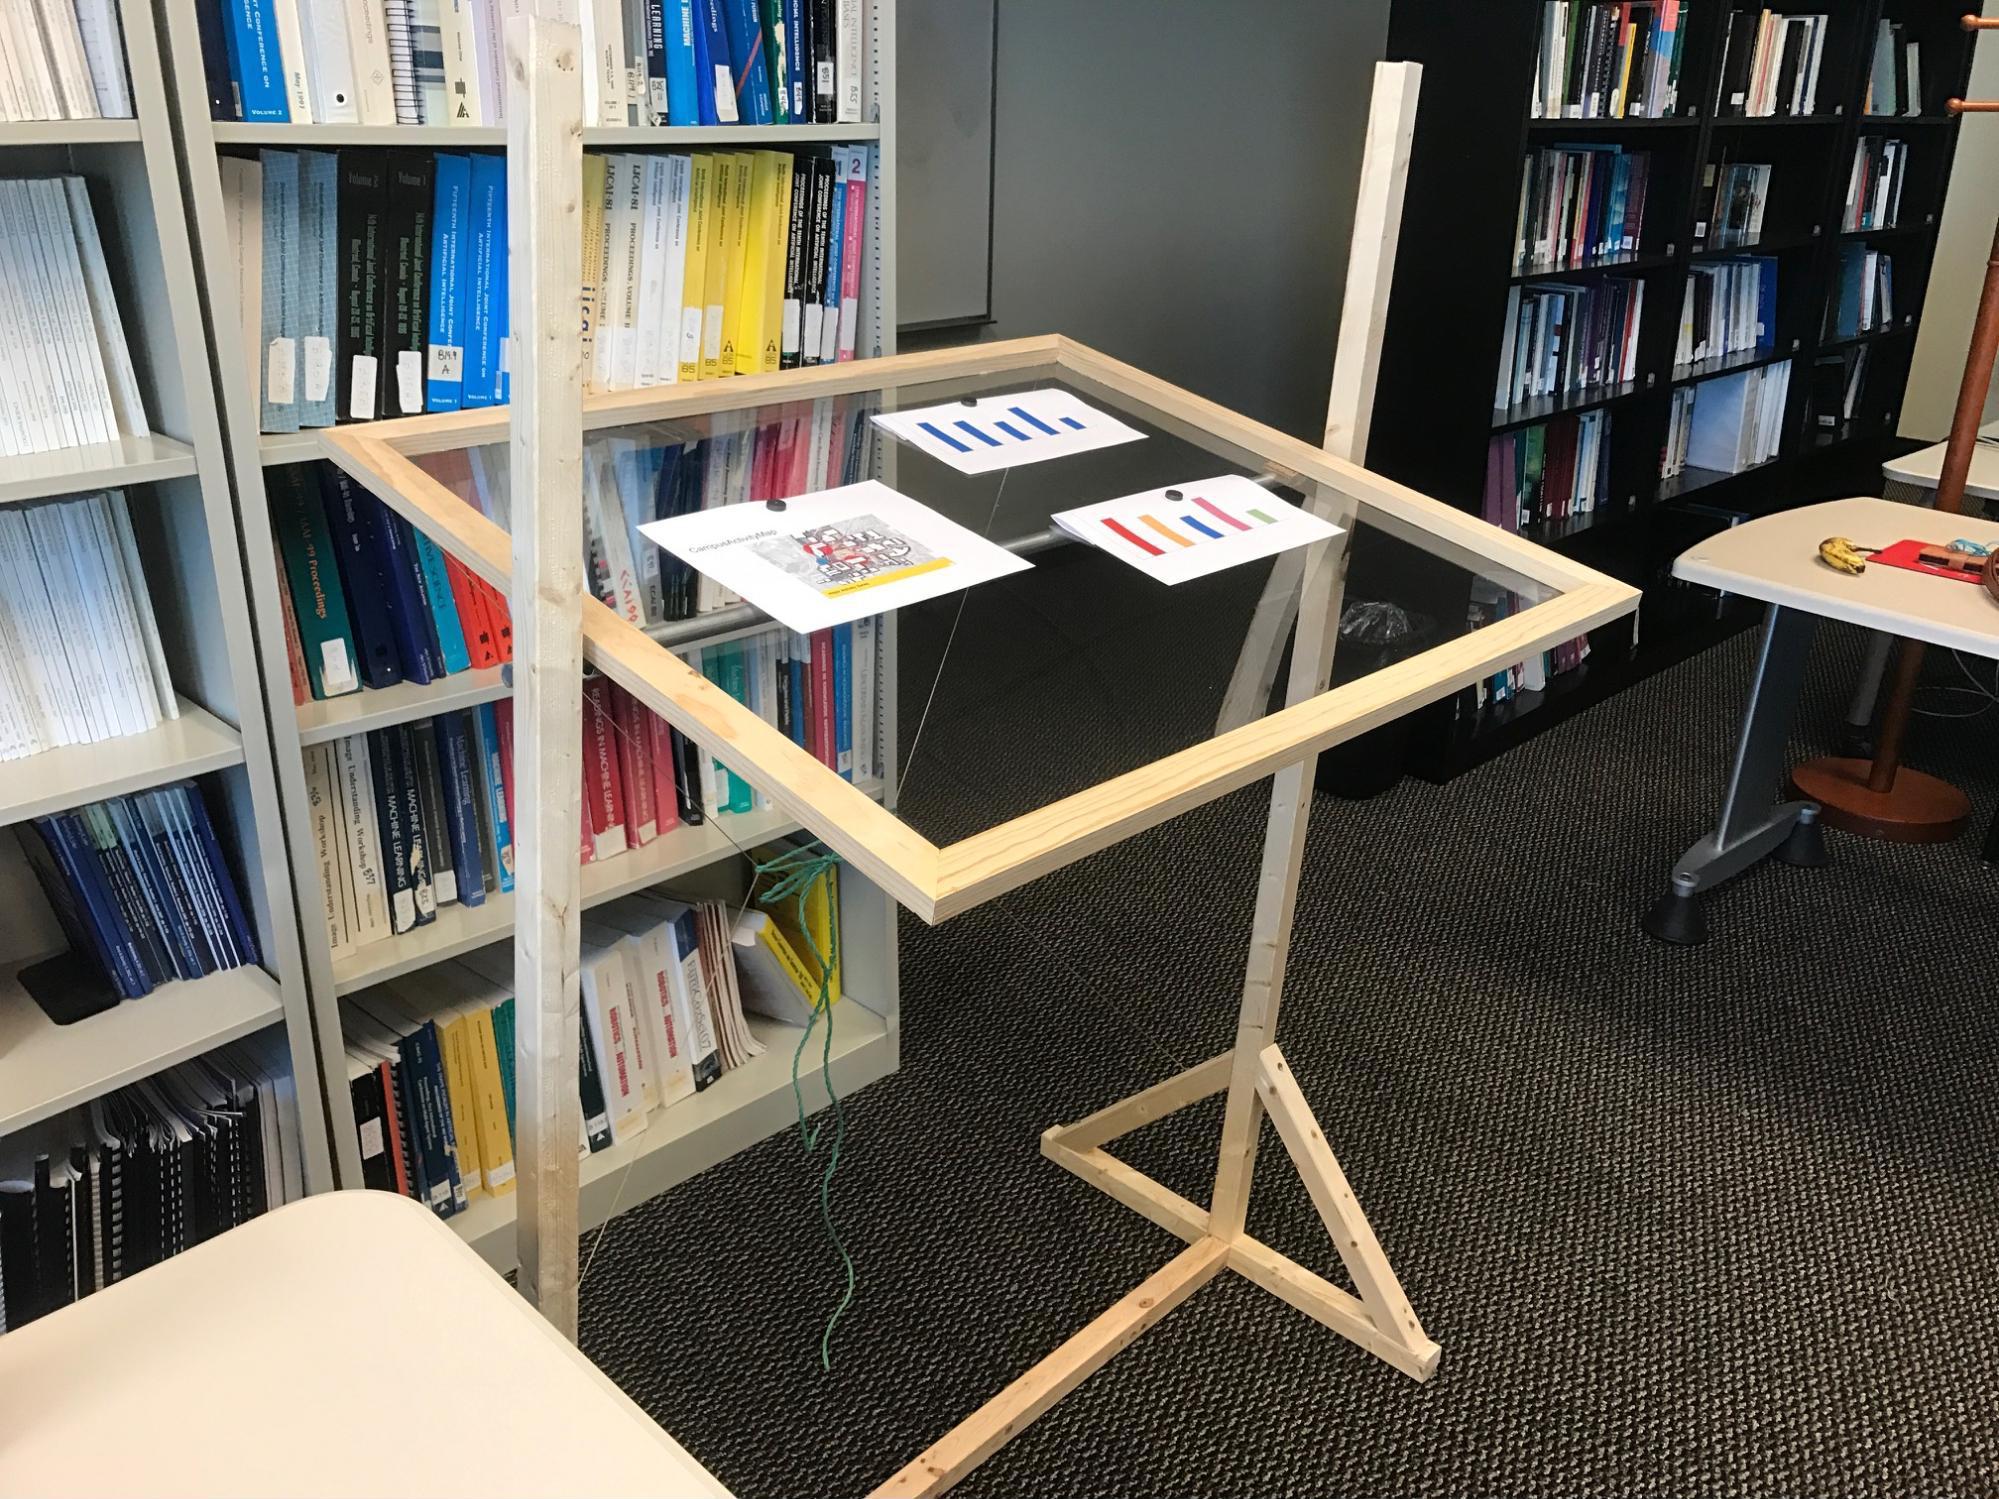
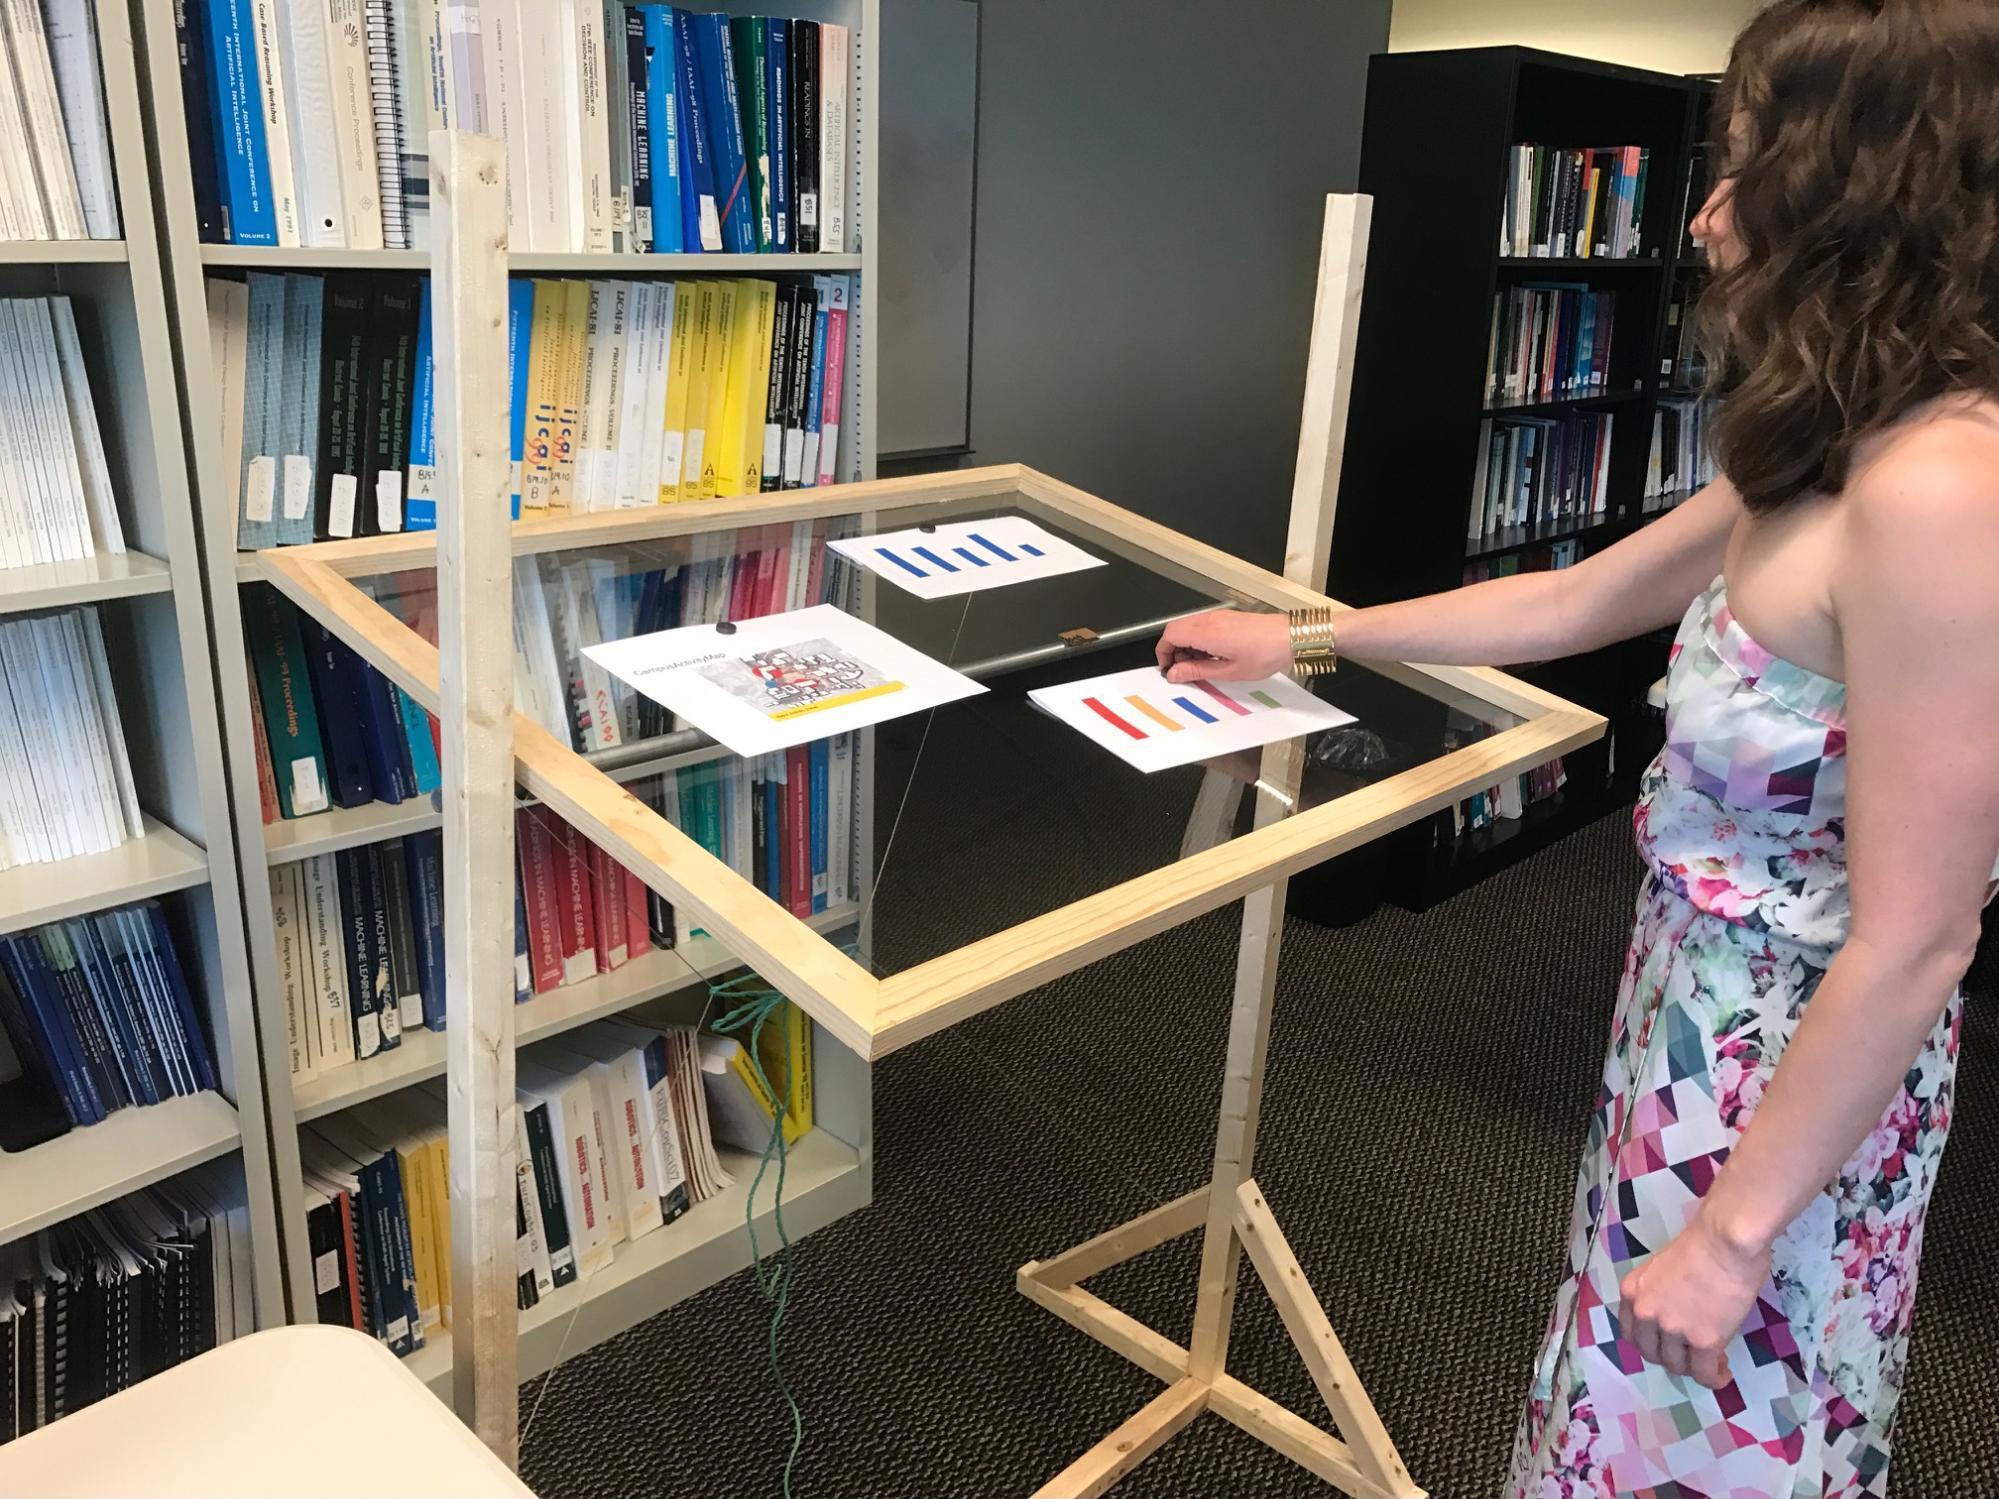
Introducing the Health Easel
Titled the Health Easel, our new in-consultation health visualization prototype system allows a patient to bring personal tracking data to their appointment and visualize relevant variables represented by simple charts on the display where both the patient and doctor can review in real-time to make informed health decisions.
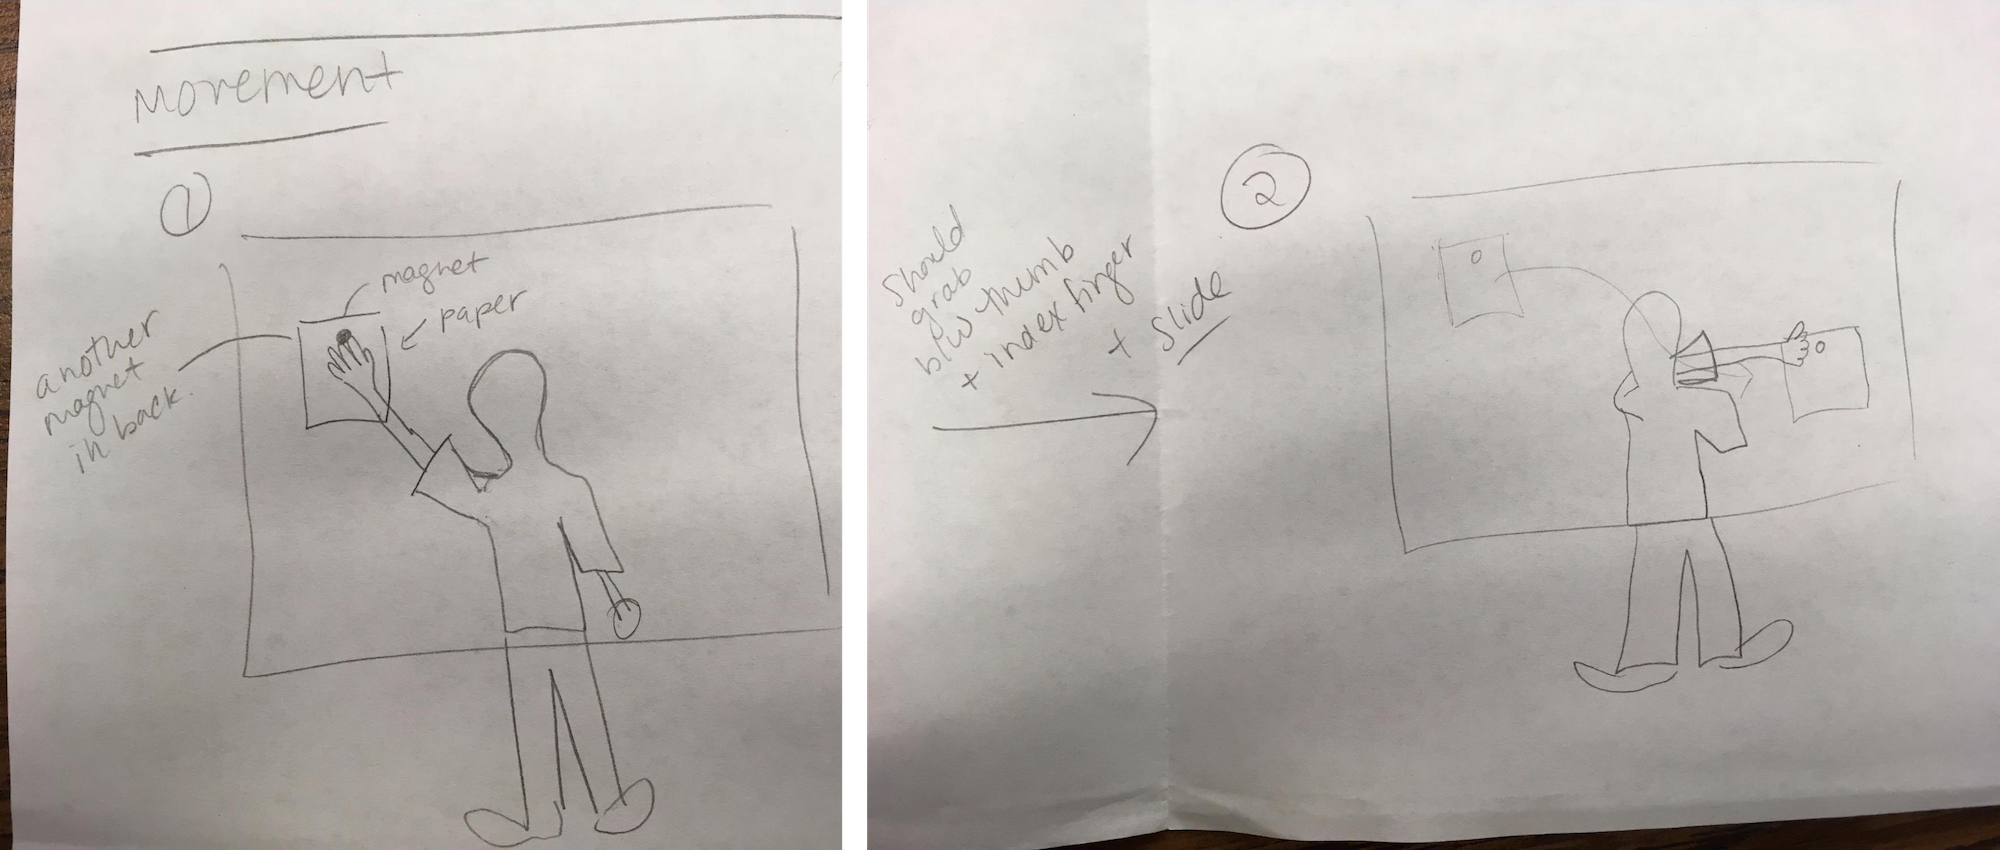
The Health Easel prototype allows users, both patients and doctors, to conduct Wizard of Oz using magnets that hold paper visualizations from the front and back to accurately mimic window movement on a transparent touch display.

We conducted interviews with both students and medical professionals to gauge their interest in such a device and how it might be used.
Student responses:
- Likes the idea of a system that can be used to explore data collaboratively with a doctor.
- Thinks it should record the session, maybe records both interaction with the device as well as voices. Different color interactions to indicate who is moving or manipulating what information.
- Thinks it is best used for appointments where patient is consulting with physician, instead of the patient being passive in the appointment. Specialized appointments for quantified self consulting.
Medical professional responses:
- Liked the idea of having patients bring in real-life data for a shared conversation.
- Often explains charts but doesn’t make them. She would like to see the patient explain a chart, it might inform their decision making if they better understand their motivations and concerns.
- Felt comfortable interpreting data charts “on the fly” as it is a normal part of their job. However, they typically have time to interpret the information before seeing the patient but wouldn’t mind working through it with an interested patient.
Wizard of Oz Co-Design Workshop
We developed a co-design workshop which focuses on doctor and patient Q&A session during a primary care appointment while incorporating Campus Life data using the Health Easel. In this scenario, we have participants role play with a member of the research team (roles include doctor and patient). In this scenario, we instruct the participant to imagine that a patient who regularly tracks their own data as part of the quantified self movement chooses to consult with their physician on specific data points during their yearly physical exam.
During the Wizard of Oz session we pose pre-identified questions to our participant in order to prompt the participant to create data visualizations in order to have a discussion about the student’s health.
A post-experiment questionnaire was given. Selected responses are below:
Question: Do you feel that Health Easel changed the way you interact with students?
It could. I think it could. It would either reduce or increase the amount of patients we see. Some patients might try to use this system to tele-health, which could be both a good or bad thing. Alternatively, a system like this might be helpful if it were able to remote access so that a physician can offer assistance to patients in rural communities.
Yes. It felt like I was more in control and could participate in a conversation about my own health.
Way more data in this. I love it!
Poster Presentation and Final Comments
Ar the end of the semester, our class held a public poster session where our team presented the Health Easel.
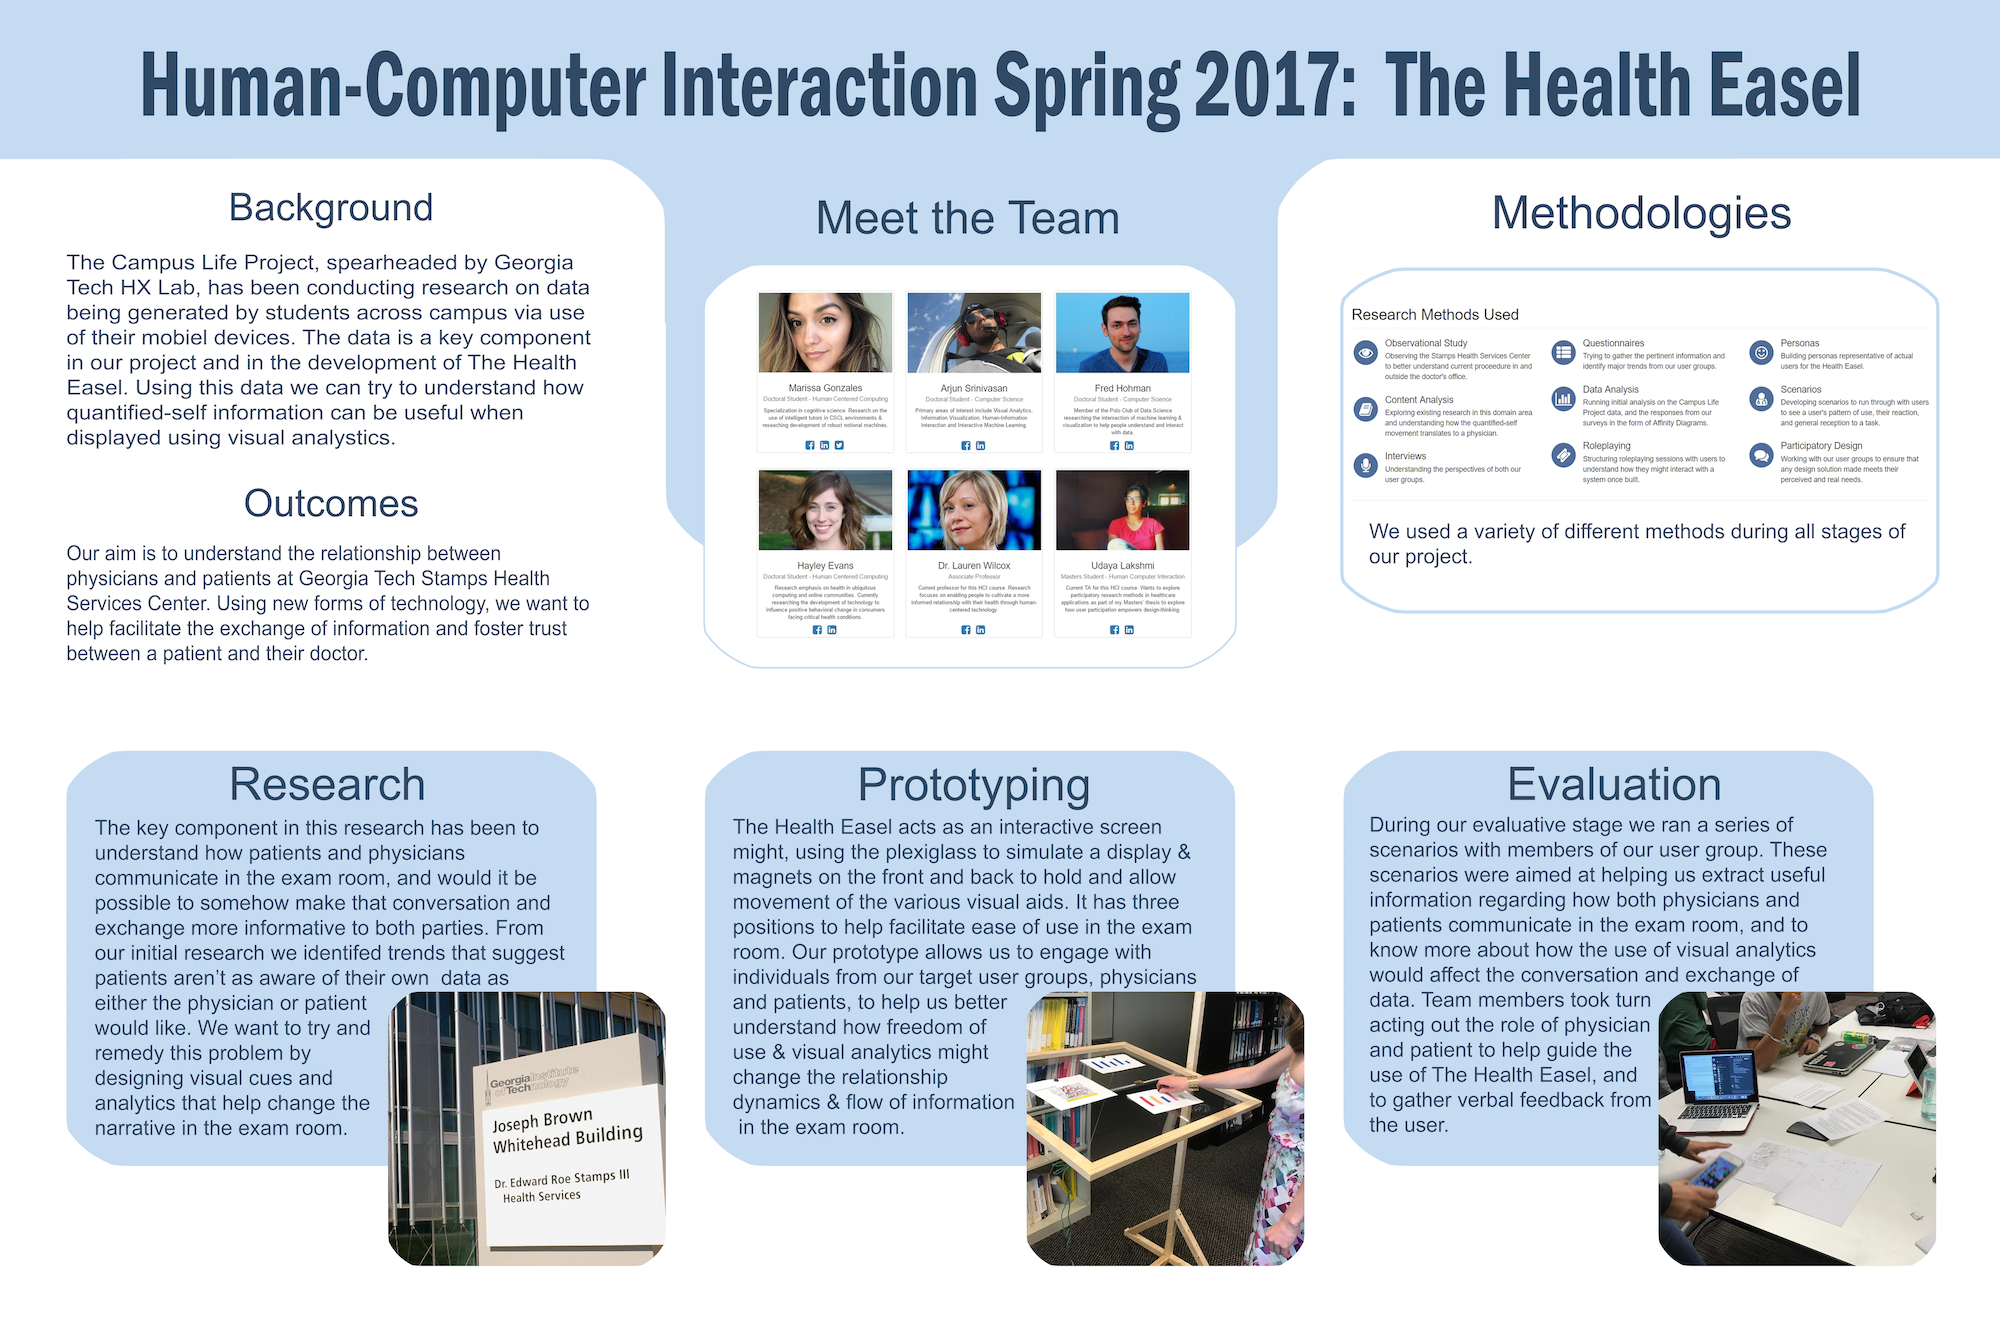
Our group identified a few key areas to improve on for future work, including the ability to filter information quickly when visualizing data, an option to save the discussion for later use, and ensuring the prototype height could be adjustable to accommodate more people.
Project Members
Links
-
Self-tracking for Mental Wellness: Understanding Expert Perspectives and Student Experiences. Christina Kelley, Bongshin Lee, Lauren Wilcox. ACM Conference on Human Factors in Computing (CHI). Denver, CO. May 2017. ↩