Fred Hohman, Minsuk Kahng, Robert Pienta, Duen Horng Chau
Deep learning has recently seen rapid development and significant attention due to its state-of-the-art performance on previously-thought hard problems. However, because of the innate complexity and nonlinear structure of deep neural networks, the underlying decision making processes for why these models are achieving such high performance are challenging and sometimes mystifying to interpret.
As deep learning spreads across domains, it is of paramount importance that we equip users of deep learning with tools for understanding when a model works correctly, when it fails, and ultimately how to improve its performance. Standardized toolkits for building neural networks have helped democratize deep learning; visual analytics systems have now been developed to support model explanation, interpretation, debugging, and improvement.
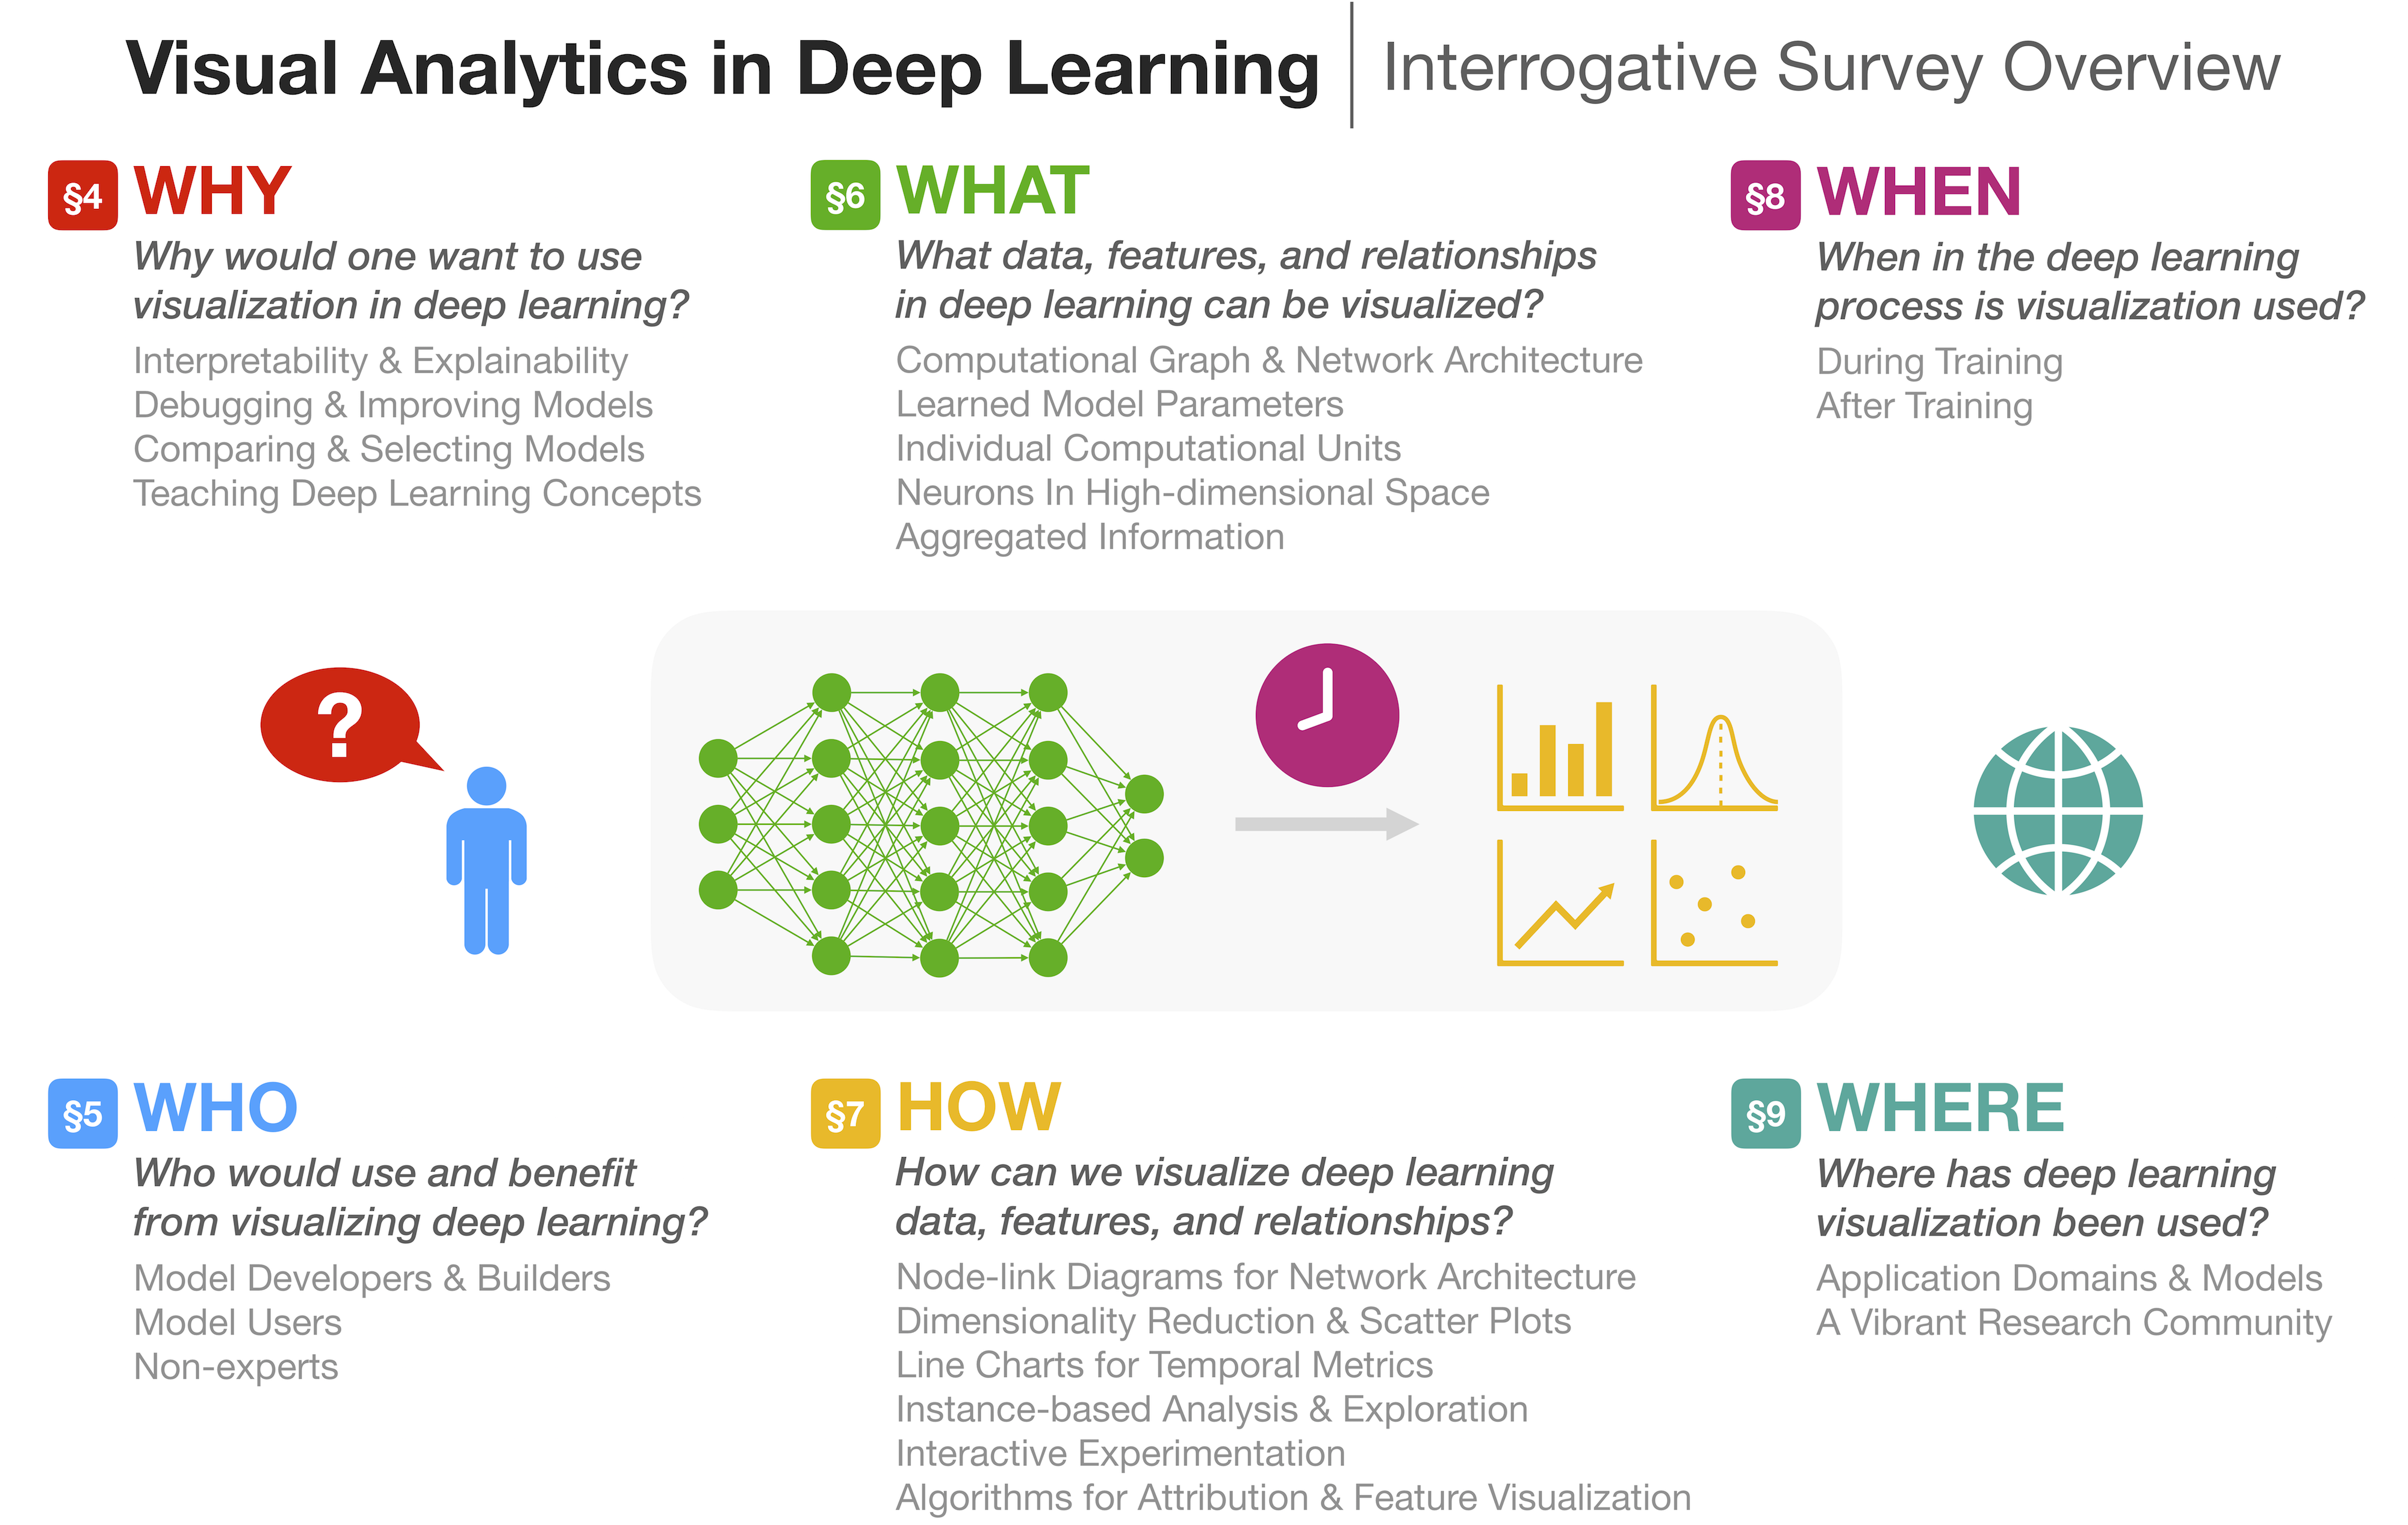
We present a survey of the role of visual analytics in deep learning research, noting its short yet impactful history and summarize the state-of-the-art using a human-centered interrogative framework, focusing on the Five W’s and How (Why, Who, What, How, When, and Where), to thoroughly summarize deep learning visual analytics research. We conclude by highlighting research directions and open research problems.
This survey helps new researchers and practitioners in both visual analytics and deep learning to quickly learn key aspects of this young and rapidly growing body of research, whose impact spans a diverse range of domains.
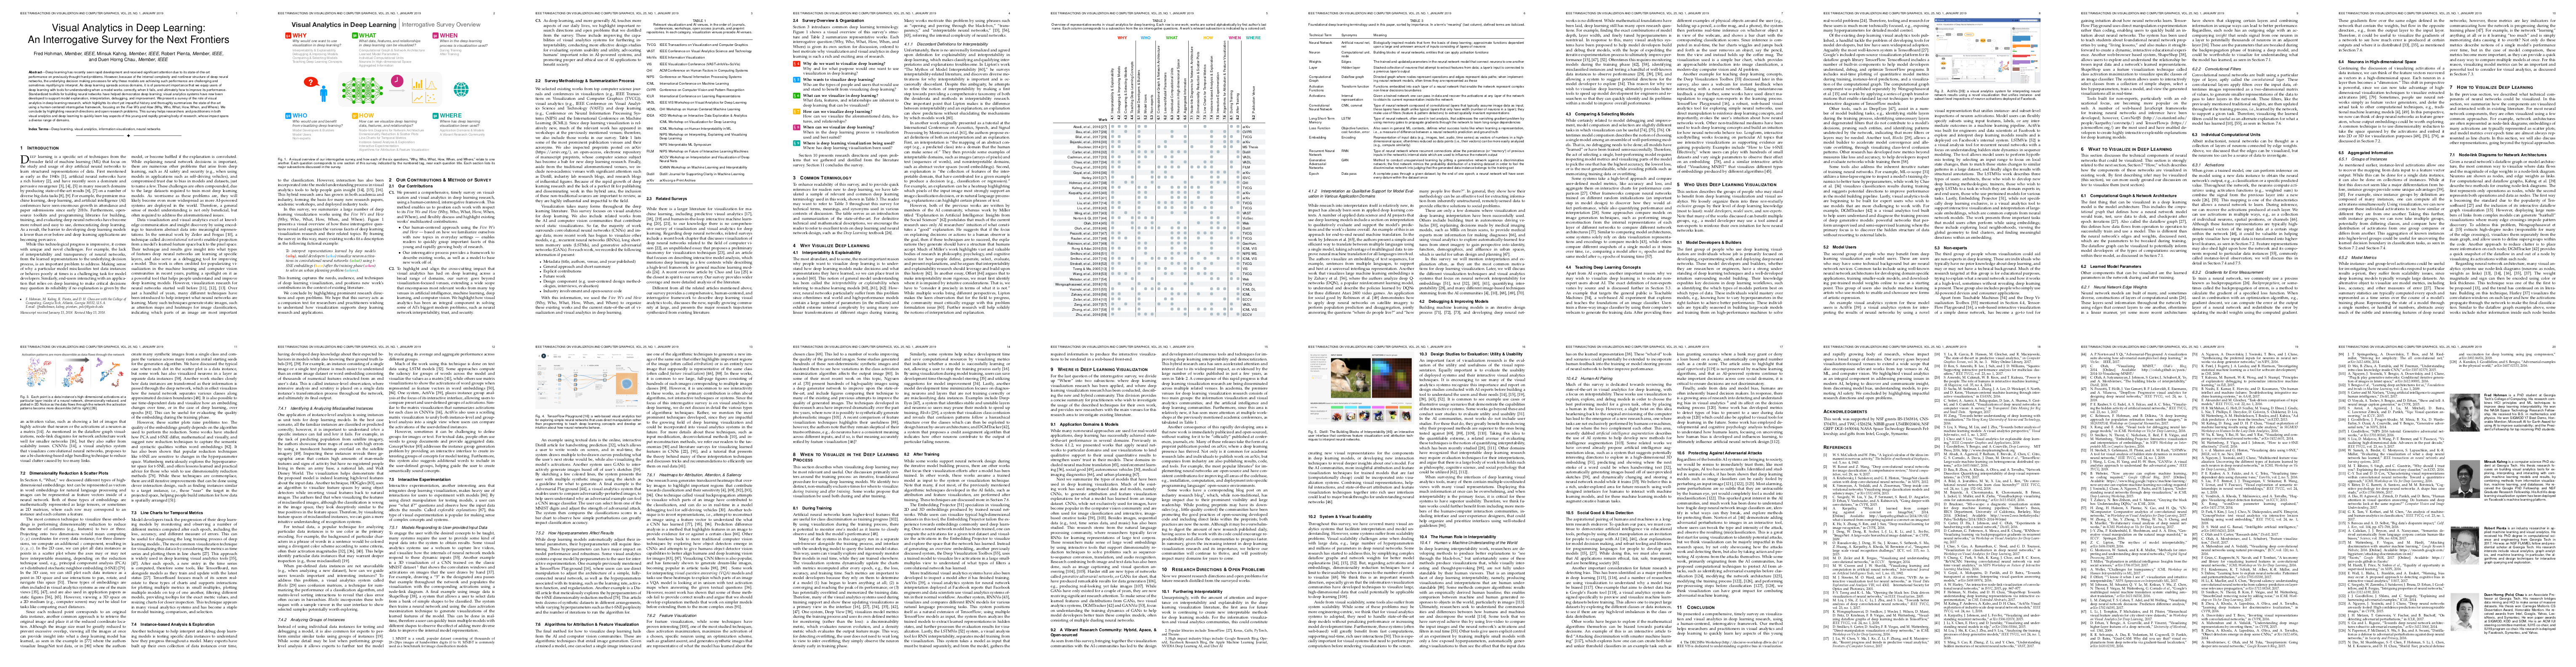
Overview of representative works in visual analytics for deep learning. Each row is one work; works are sorted alphabetically by first author’s lastname. Each column corresponds to a subsection from the six interrogative questions. A work’s relevant subsection is indicated by a colored cell.
WHY |
WHO |
WHAT |
HOW |
WHEN |
WHERE |
|||||||||||||||||
Author |
Year |
Interpretability & Explainability |
Debugging & Improving Models |
Comparing & Selecting Models |
Education |
Model Developers & Builders |
Model Users |
Non-experts |
Computational Graph & Network Architecture |
Learned Model Parameters |
Individual Computational Units |
Neurons in High-dimensional Space |
Aggregated Information |
Node-link Diagrams for Network Architecture |
Dimensionality Reduction & Scatter Plots |
Line Charts for Temporal Metrics |
Instance-based Analysis & Exploration |
Interactive Experimentation |
Algorithms for Attribution & Feature Visualization |
During Training |
After Training |
Publication Venue |
| Abadi, et al. | 2016 | arXiv | ||||||||||||||||||||
| Bau, et al. | 2017 | CVPR | ||||||||||||||||||||
| Bilal, et al. | 2017 | TVCG | ||||||||||||||||||||
| Bojarski, et al. | 2016 | arXiv | ||||||||||||||||||||
| Bruckner | 2014 | MS Thesis | ||||||||||||||||||||
| Carter, et al. | 2016 | Distill | ||||||||||||||||||||
| Cashman, et al. | 2017 | VADL | ||||||||||||||||||||
| Chae, et al. | 2017 | VADL | ||||||||||||||||||||
| Chung, et al. | 2016 | FILM | ||||||||||||||||||||
| Goyal, et al. | 2016 | arXiv | ||||||||||||||||||||
| Harley | 2015 | ISVC | ||||||||||||||||||||
| Hohman, et al. | 2017 | CHI | ||||||||||||||||||||
| Kahng, et al. | 2018 | TVCG | ||||||||||||||||||||
| Karpathy, et al. | 2015 | arXiv | ||||||||||||||||||||
| Li, et al. | 2015 | arXiv | ||||||||||||||||||||
| Liu, et al. | 2017 | TVCG | ||||||||||||||||||||
| Liu, et al. | 2018 | TVCG | ||||||||||||||||||||
| Ming, et al. | 2017 | VAST | ||||||||||||||||||||
| Norton & Qi | 2017 | VizSec | ||||||||||||||||||||
| Olah | 2014 | Web | ||||||||||||||||||||
| Olah, et al. | 2018 | Distill | ||||||||||||||||||||
| Pezzotti, et al. | 2017 | TVCG | ||||||||||||||||||||
| Rauber, et al. | 2017 | TVCG | ||||||||||||||||||||
| Robinson, et al. | 2017 | GeoHum. | ||||||||||||||||||||
| Rong, et al. | 2016 | ICML VIS | ||||||||||||||||||||
| Smilkov, et al. | 2016 | NIPS Workshop | ||||||||||||||||||||
| Smilkov, et al. | 2017 | ICML VIS | ||||||||||||||||||||
| Strobelt, et al. | 2017 | TVCG | ||||||||||||||||||||
| Tzeng & Ma | 2005 | VIS | ||||||||||||||||||||
| Wang, et al. | 2018 | TVCG | ||||||||||||||||||||
| Webster, et al. | 2017 | Web | ||||||||||||||||||||
| Wongsuphasawat, et al. | 2018 | TVCG | ||||||||||||||||||||
| Yosinski, et al. | 2015 | ICML DL | ||||||||||||||||||||
| Zahavy, et al. | 2016 | ICML | ||||||||||||||||||||
| Zeiler, et al. | 2014 | ECCV | ||||||||||||||||||||
| Zeng, et al. | 2017 | VADL | ||||||||||||||||||||
| Zhong, et al. | 2017 | ICML VIS | ||||||||||||||||||||
| Zhu, et al. | 2016 | ECCV | ||||||||||||||||||||
| Kahng, et al. | 2018 | TVCG | ||||||||||||||||||||
| Kwon, et al. | 2018 | TVCG | ||||||||||||||||||||
| Liu, et al. | 2018 | TVCG | ||||||||||||||||||||
| Liu, et al. | 2018 | VAST | ||||||||||||||||||||
| Strobelt, et al. | 2018 | TVCG | ||||||||||||||||||||
| Wang, et al. | 2018 | TVCG | ||||||||||||||||||||
| Zhang, et al. | 2018 | TVCG | ||||||||||||||||||||


Visual Analytics in Deep Learning: An Interrogative Survey for the Next Frontiers
Fred Hohman, Minsuk Kahng, Robert Pienta, Duen Horng Chau.
IEEE Transactions on Visualization and Computer Graphics (TVCG). 2018.
@article{hohman2018visual,
  title={Visual Analytics in Deep Learning: An Interrogative Survey for the Next Frontiers},
  author={Hohman, Fred and Kahng, Minsuk and Pienta, Robert and Chau, Duen Horng},
  journal={IEEE Transactions on Visualization and Computer Graphics},
  year={2018},
  publisher={IEEE}
}